New York, NY
Chris
Chris
Kucewicz
Data Analyst · Geospatial Analyst · Data Visualization Specialist

Data Analyst · Geospatial Analyst · Data Visualization Specialist
About me
I'm a data analyst with a passion for turning complex information into clear, actionable insight. My work spans data visualization, spatial analysis, survey design, and predictive modeling, often exploring how public investments, programs, and policies relate to community outcomes.
I'm especially interested in public-sector and civic challenges, from transportation safety to community development, and I'm actively building toward more rigorous, causally-grounded research methods to strengthen that work, using tools like Census and ACS data, R, Python, and GIS.
Outside of work, I write about data methods and tools on my blog.
Skills
Experience
NewRoot Learning Institute, Chicago, IL
Michael's Energy, Energy & Sustainability Consulting, Chicago, IL
Cook County Office of Research, Operations & Innovation, Chicago, IL
TEACH, LLC., Philadelphia, PA
Philadelphia, PA
Additional Experience
City of Philadelphia, Philadelphia, PA
Delaware Valley Regional Planning Commission, Philadelphia, PA
Kode with Klossy, New York, NY
Projects
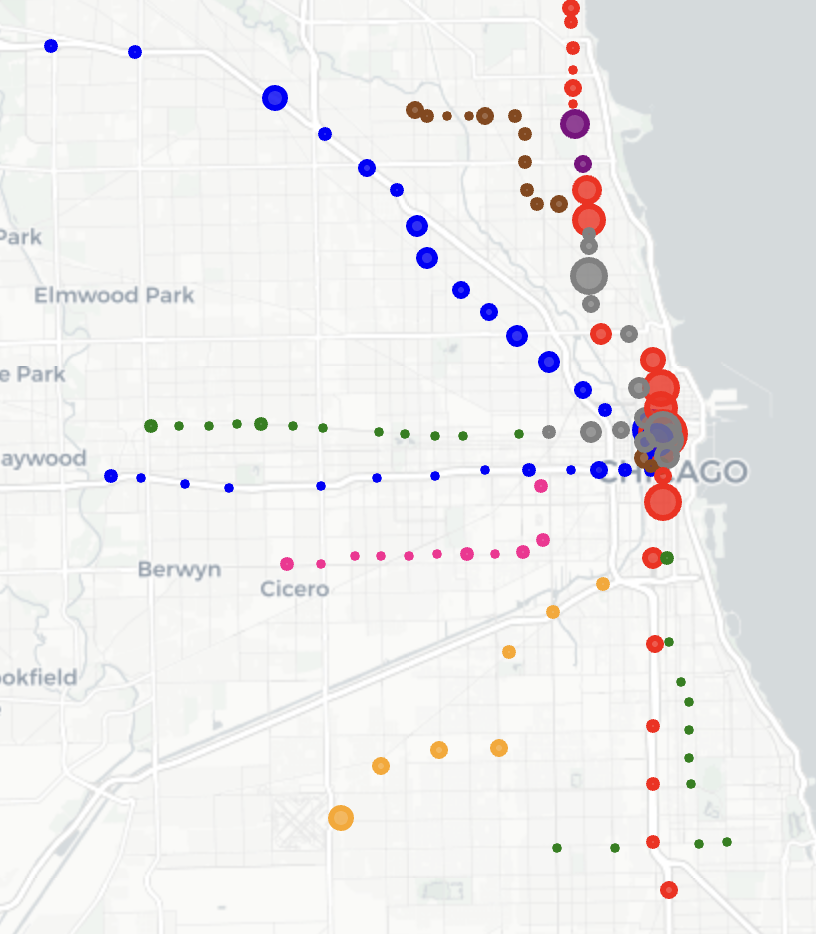
Analyzed 1.25M+ CTA 'L' records using SQL & Python to clean data, build interactive Folium/Plotly maps, and forecast post-COVID ridership recovery, projecting a plateau at ~85–90% of pre-COVID highs.
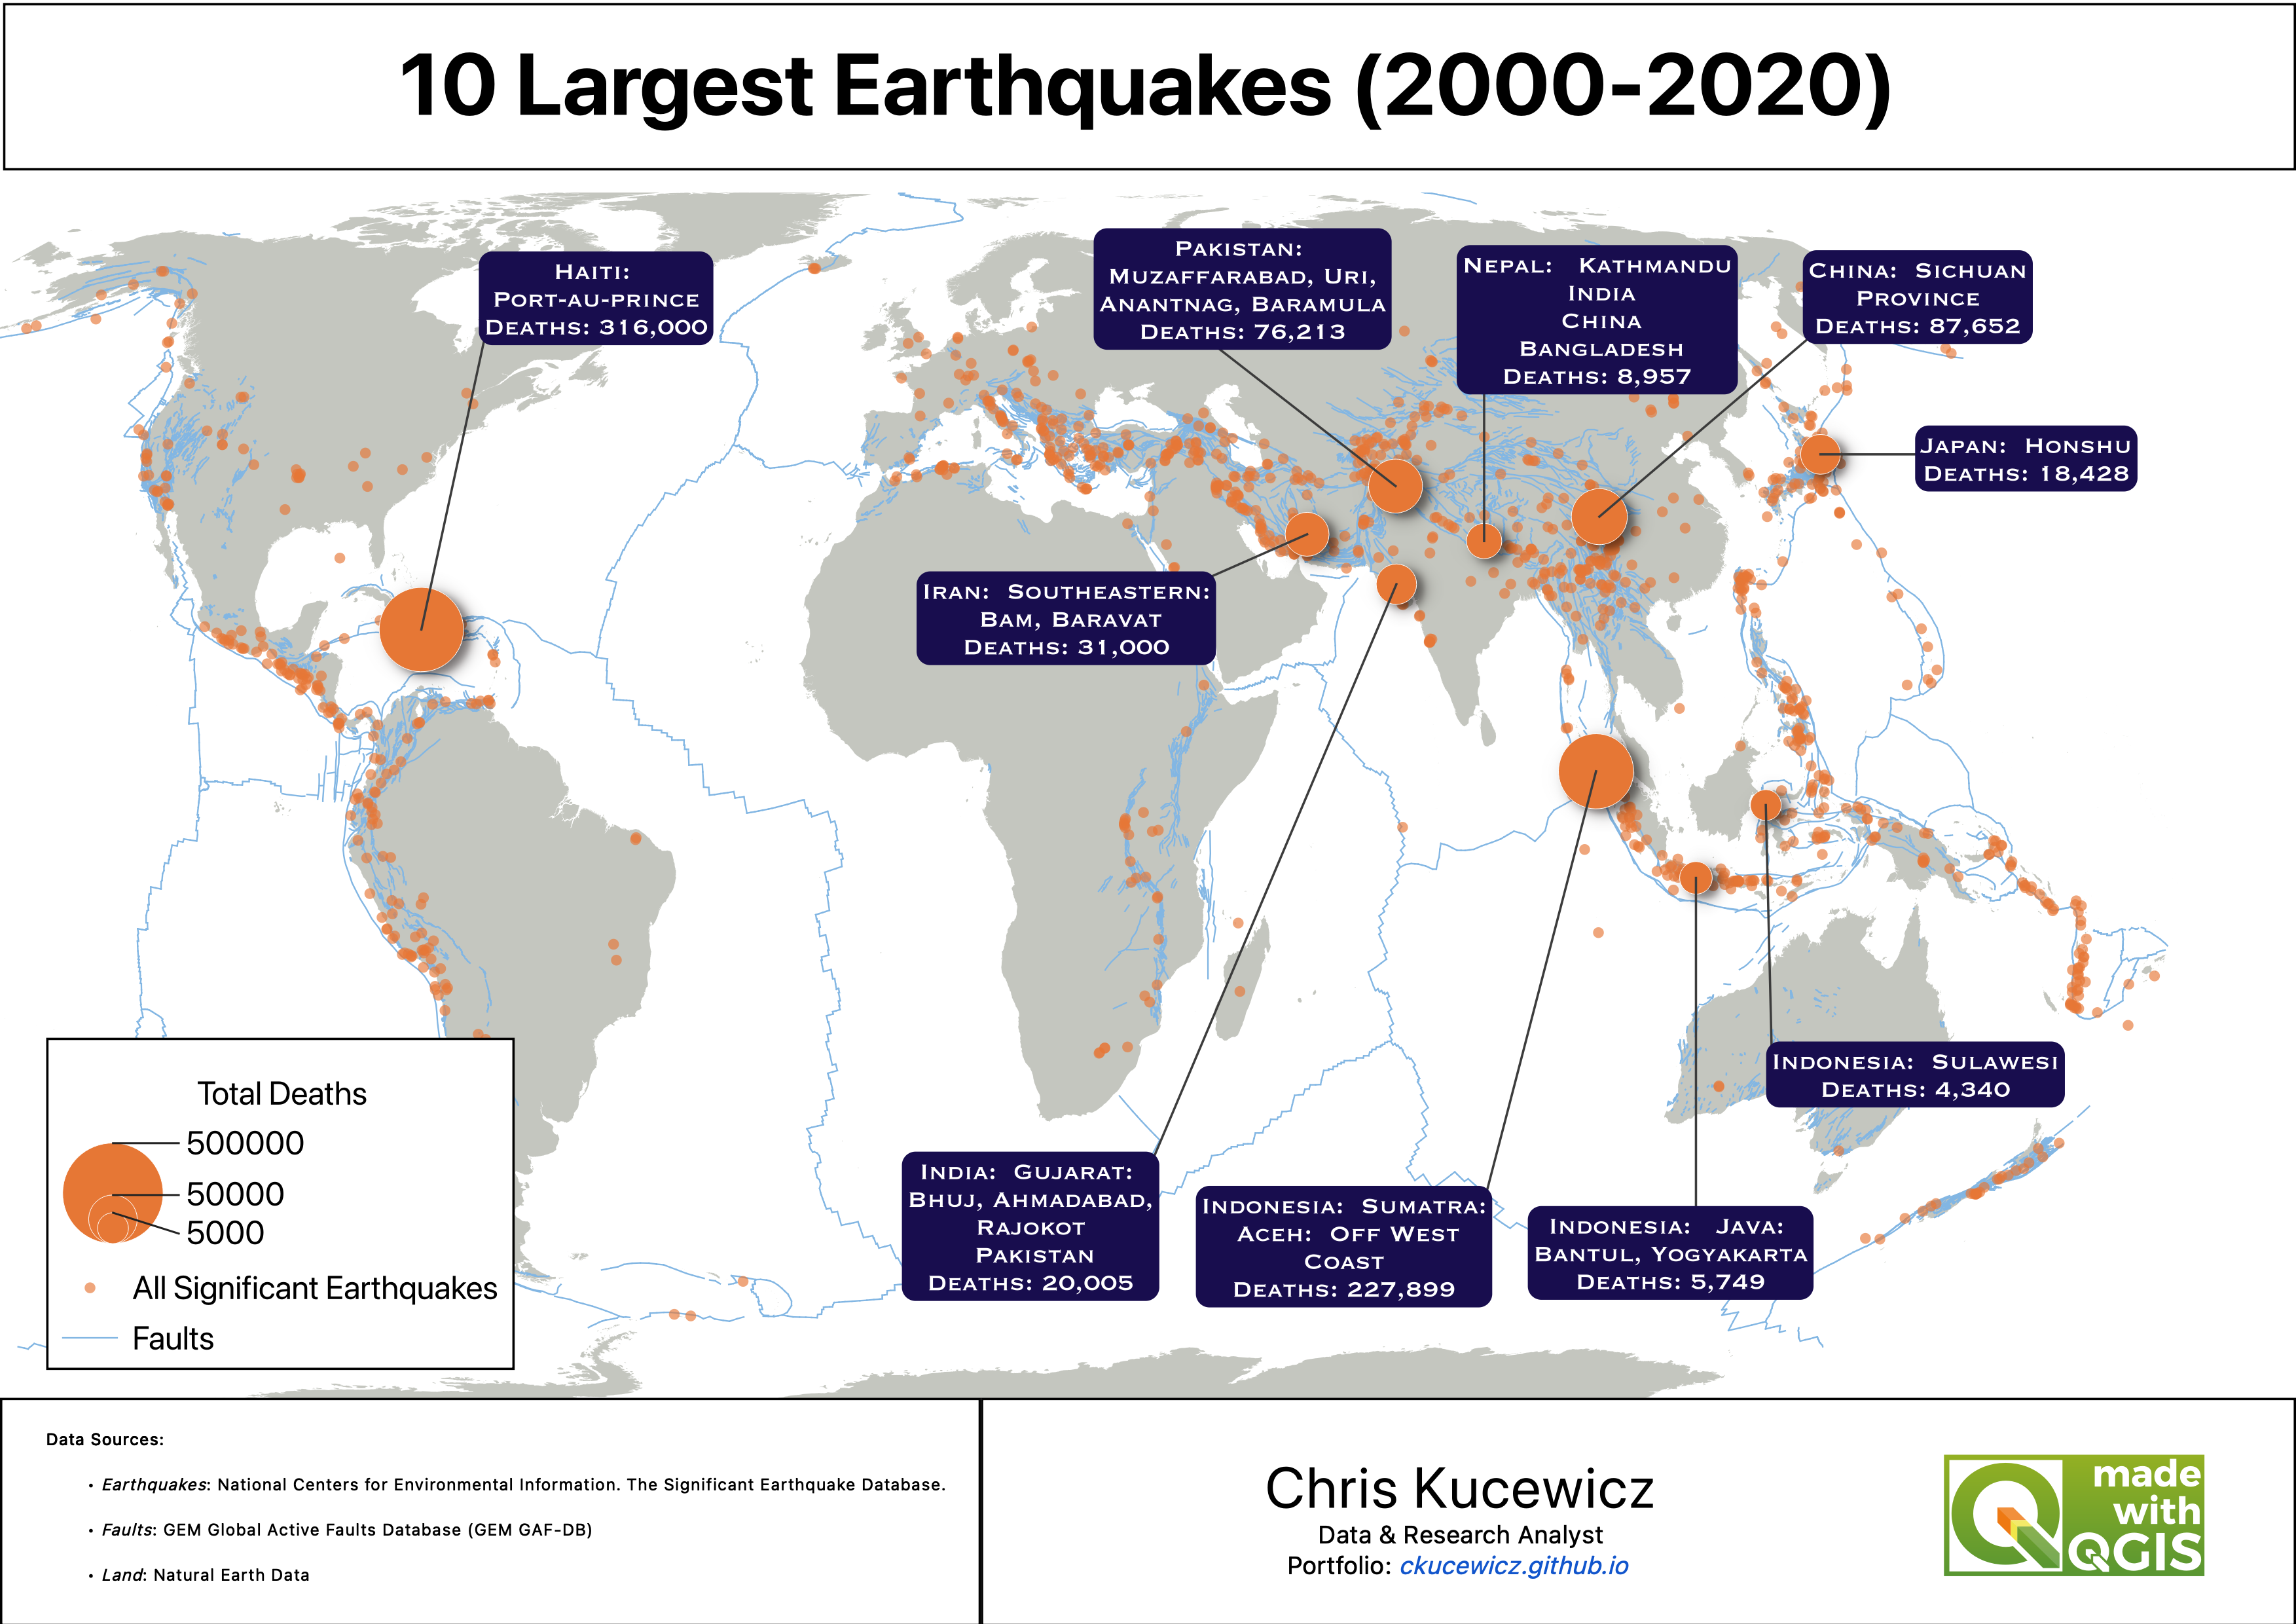
QGIS map visualizing the 10 largest earthquakes by death toll (2000–2020), with proportional symbols scaled to total deaths, fault lines, and all significant earthquakes plotted globally.
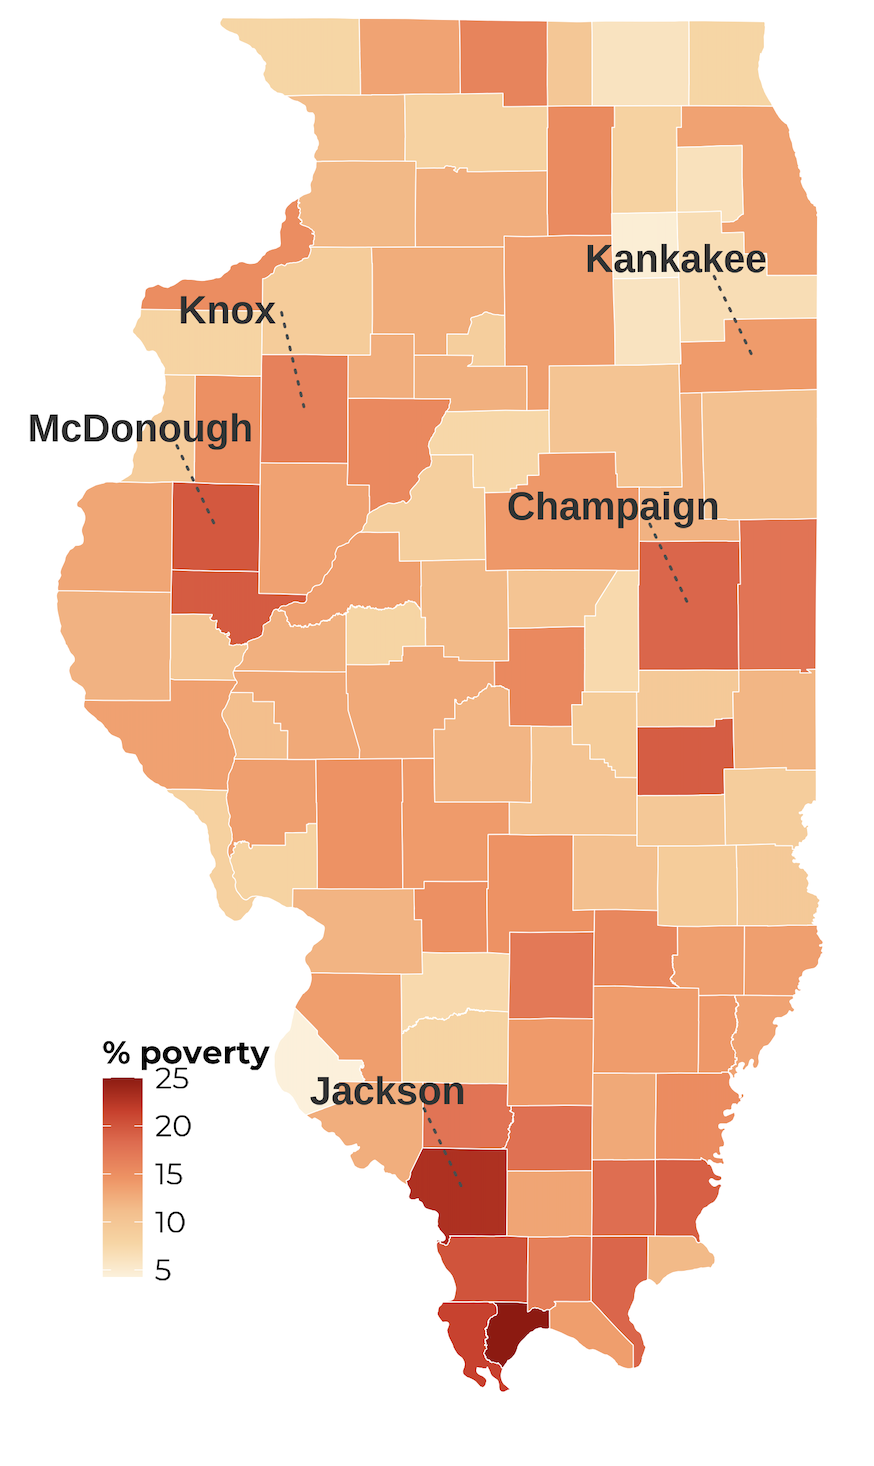
Developed a composite need score to identify which of Illinois' 102 counties would most benefit from targeted community revitalization investment, using 28 ACS variables across 5 survey years and choropleth maps.
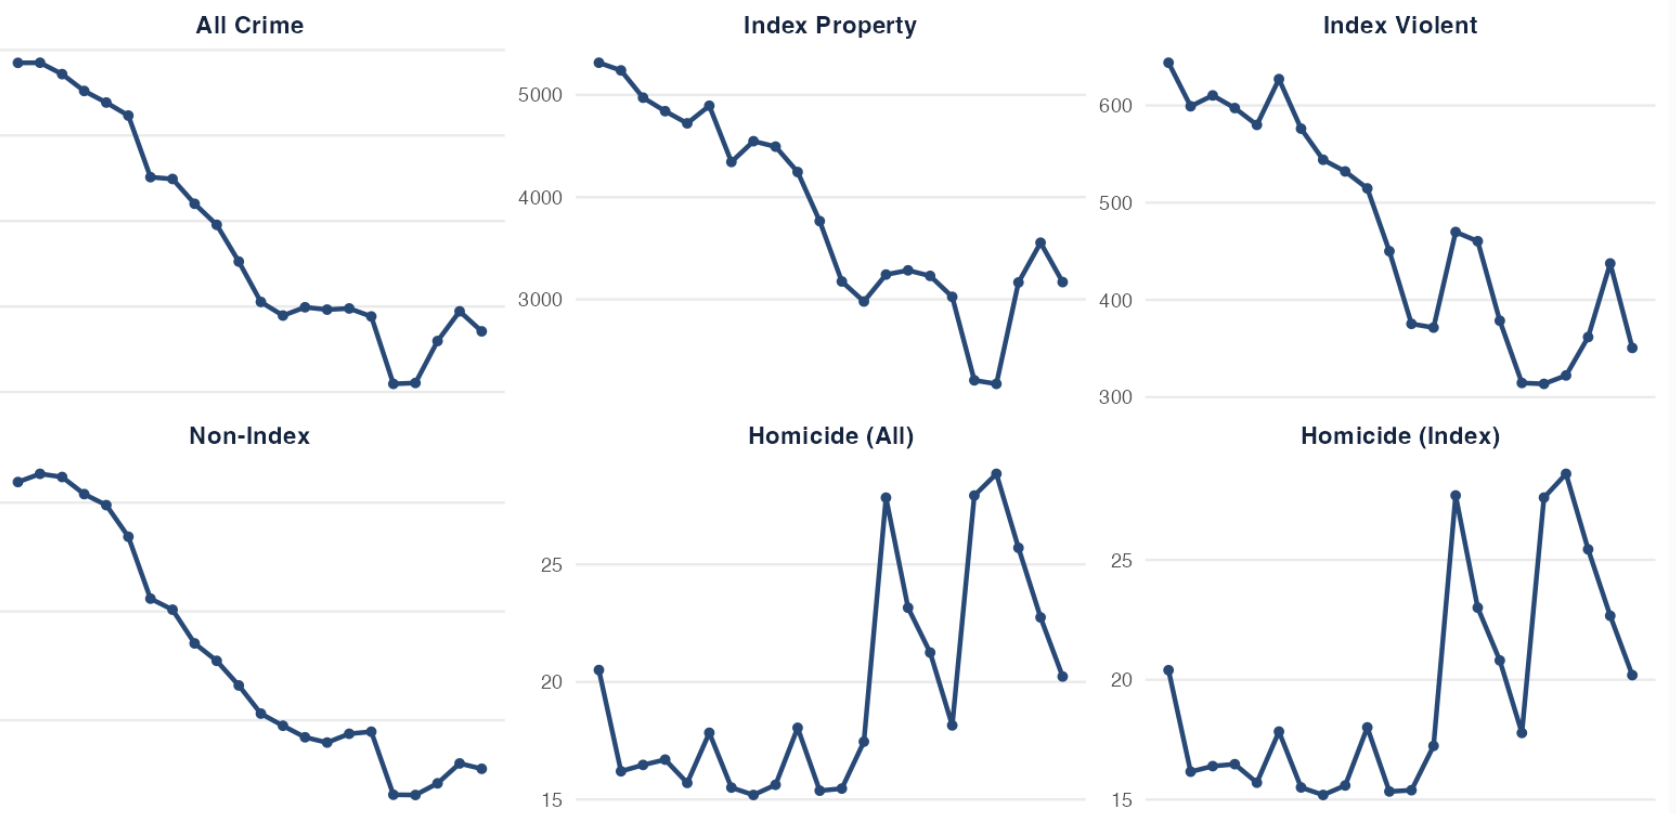
In progress. R analysis exploring how public spending (police, housing, libraries) relates to crime rates in Chicago over time, using lagged regression models and inflation-adjusted budget data.
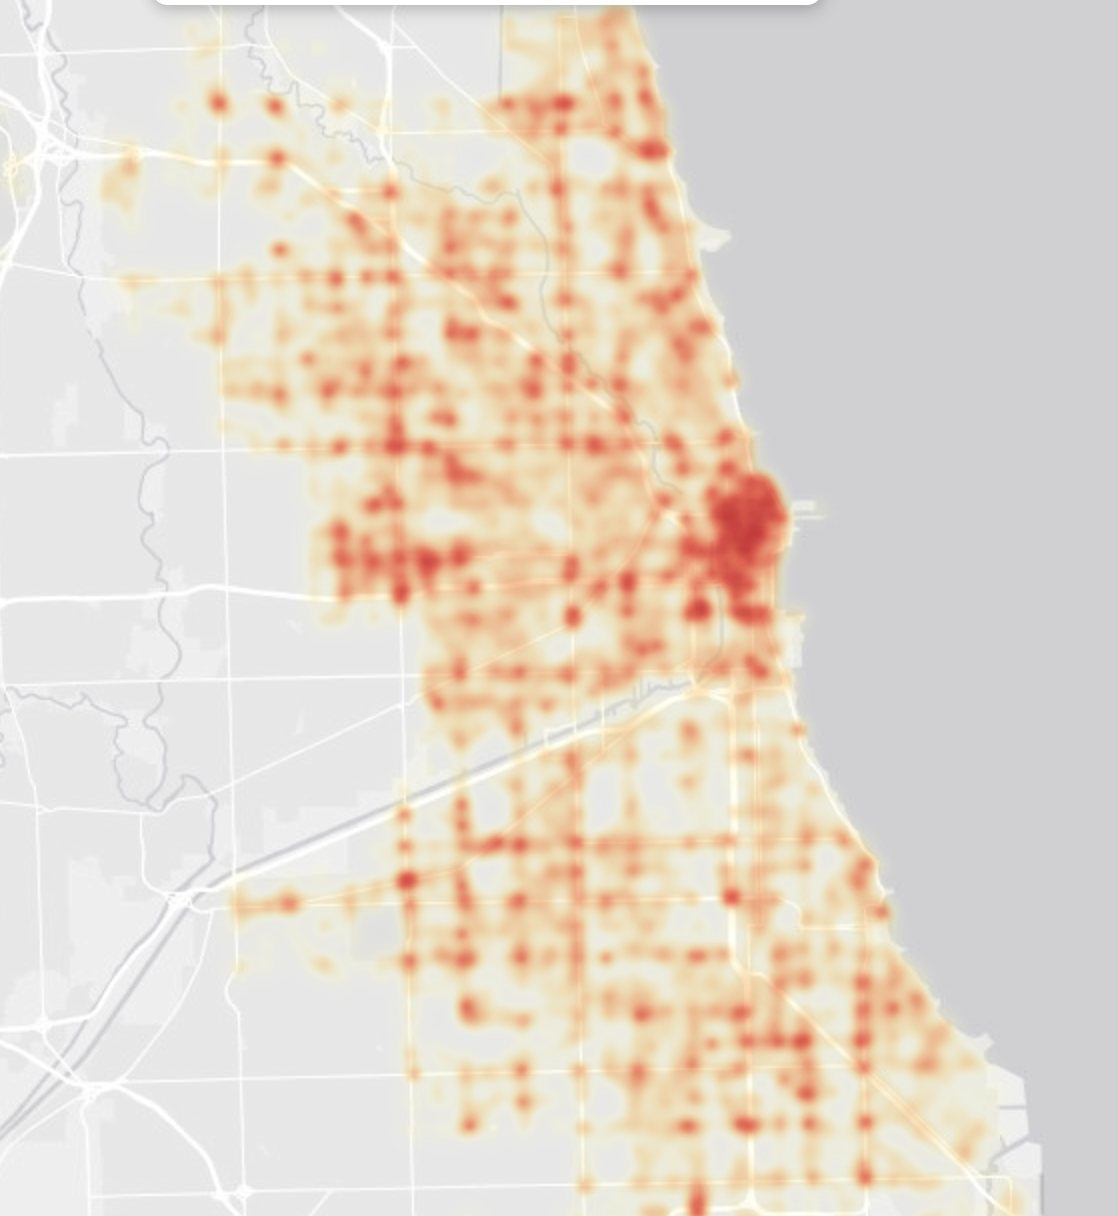
ML classification project analyzing 1M+ Chicago crash records to predict fatal crash contributors. Built a decision tree model with SMOTE for class imbalance; proposed three public policy recommendations.
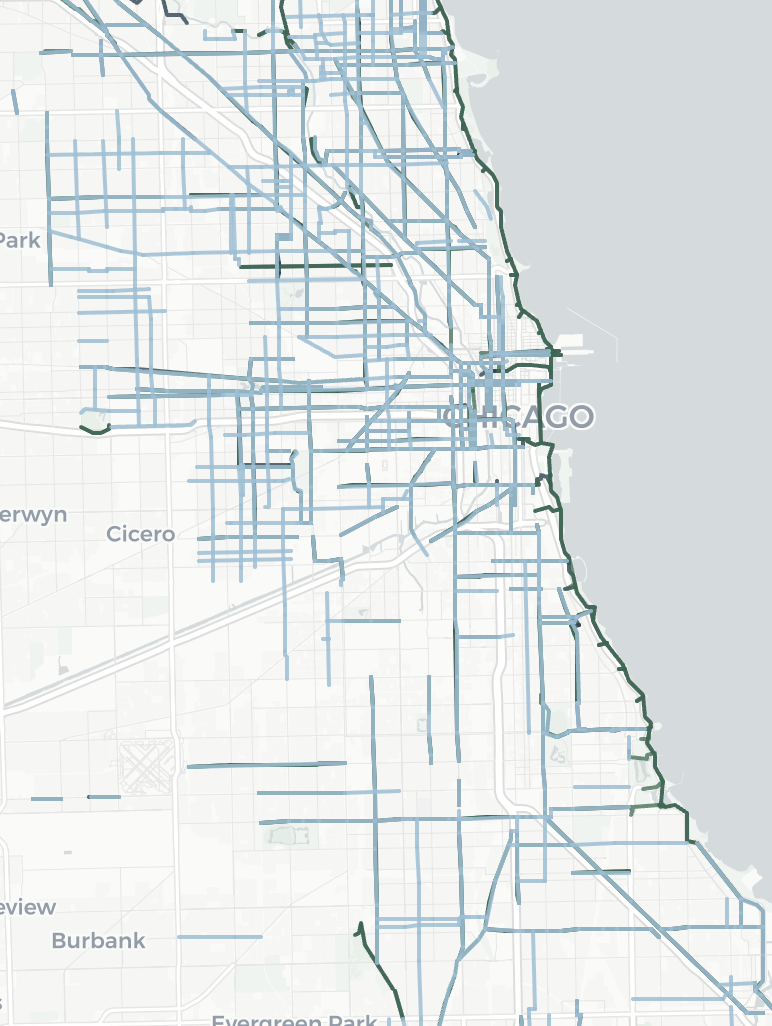
Spatial and statistical analysis exploring the relationship between bike infrastructure and housing trends across Chicago neighborhoods.
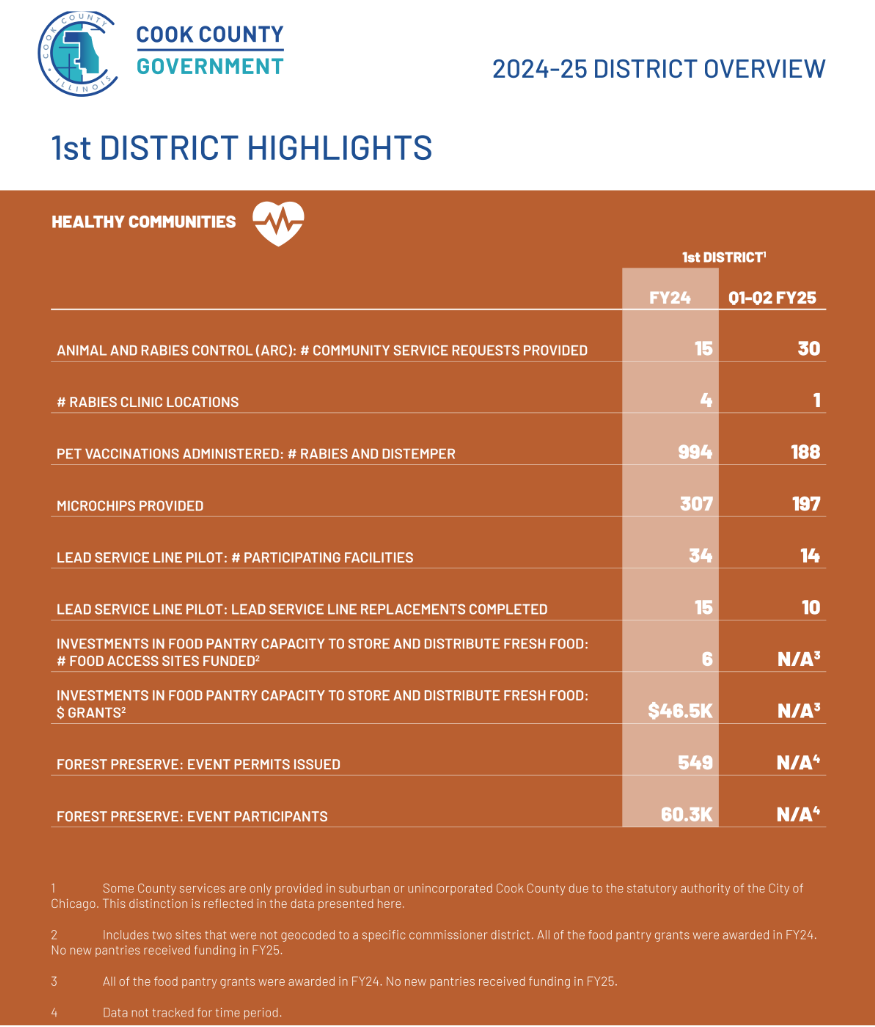
Integrated Census API, ZIP-level data, and district shapefiles to build a unified dataset for Cook County's public-facing impact report, covering 17 districts with population-weighted district-level metrics.
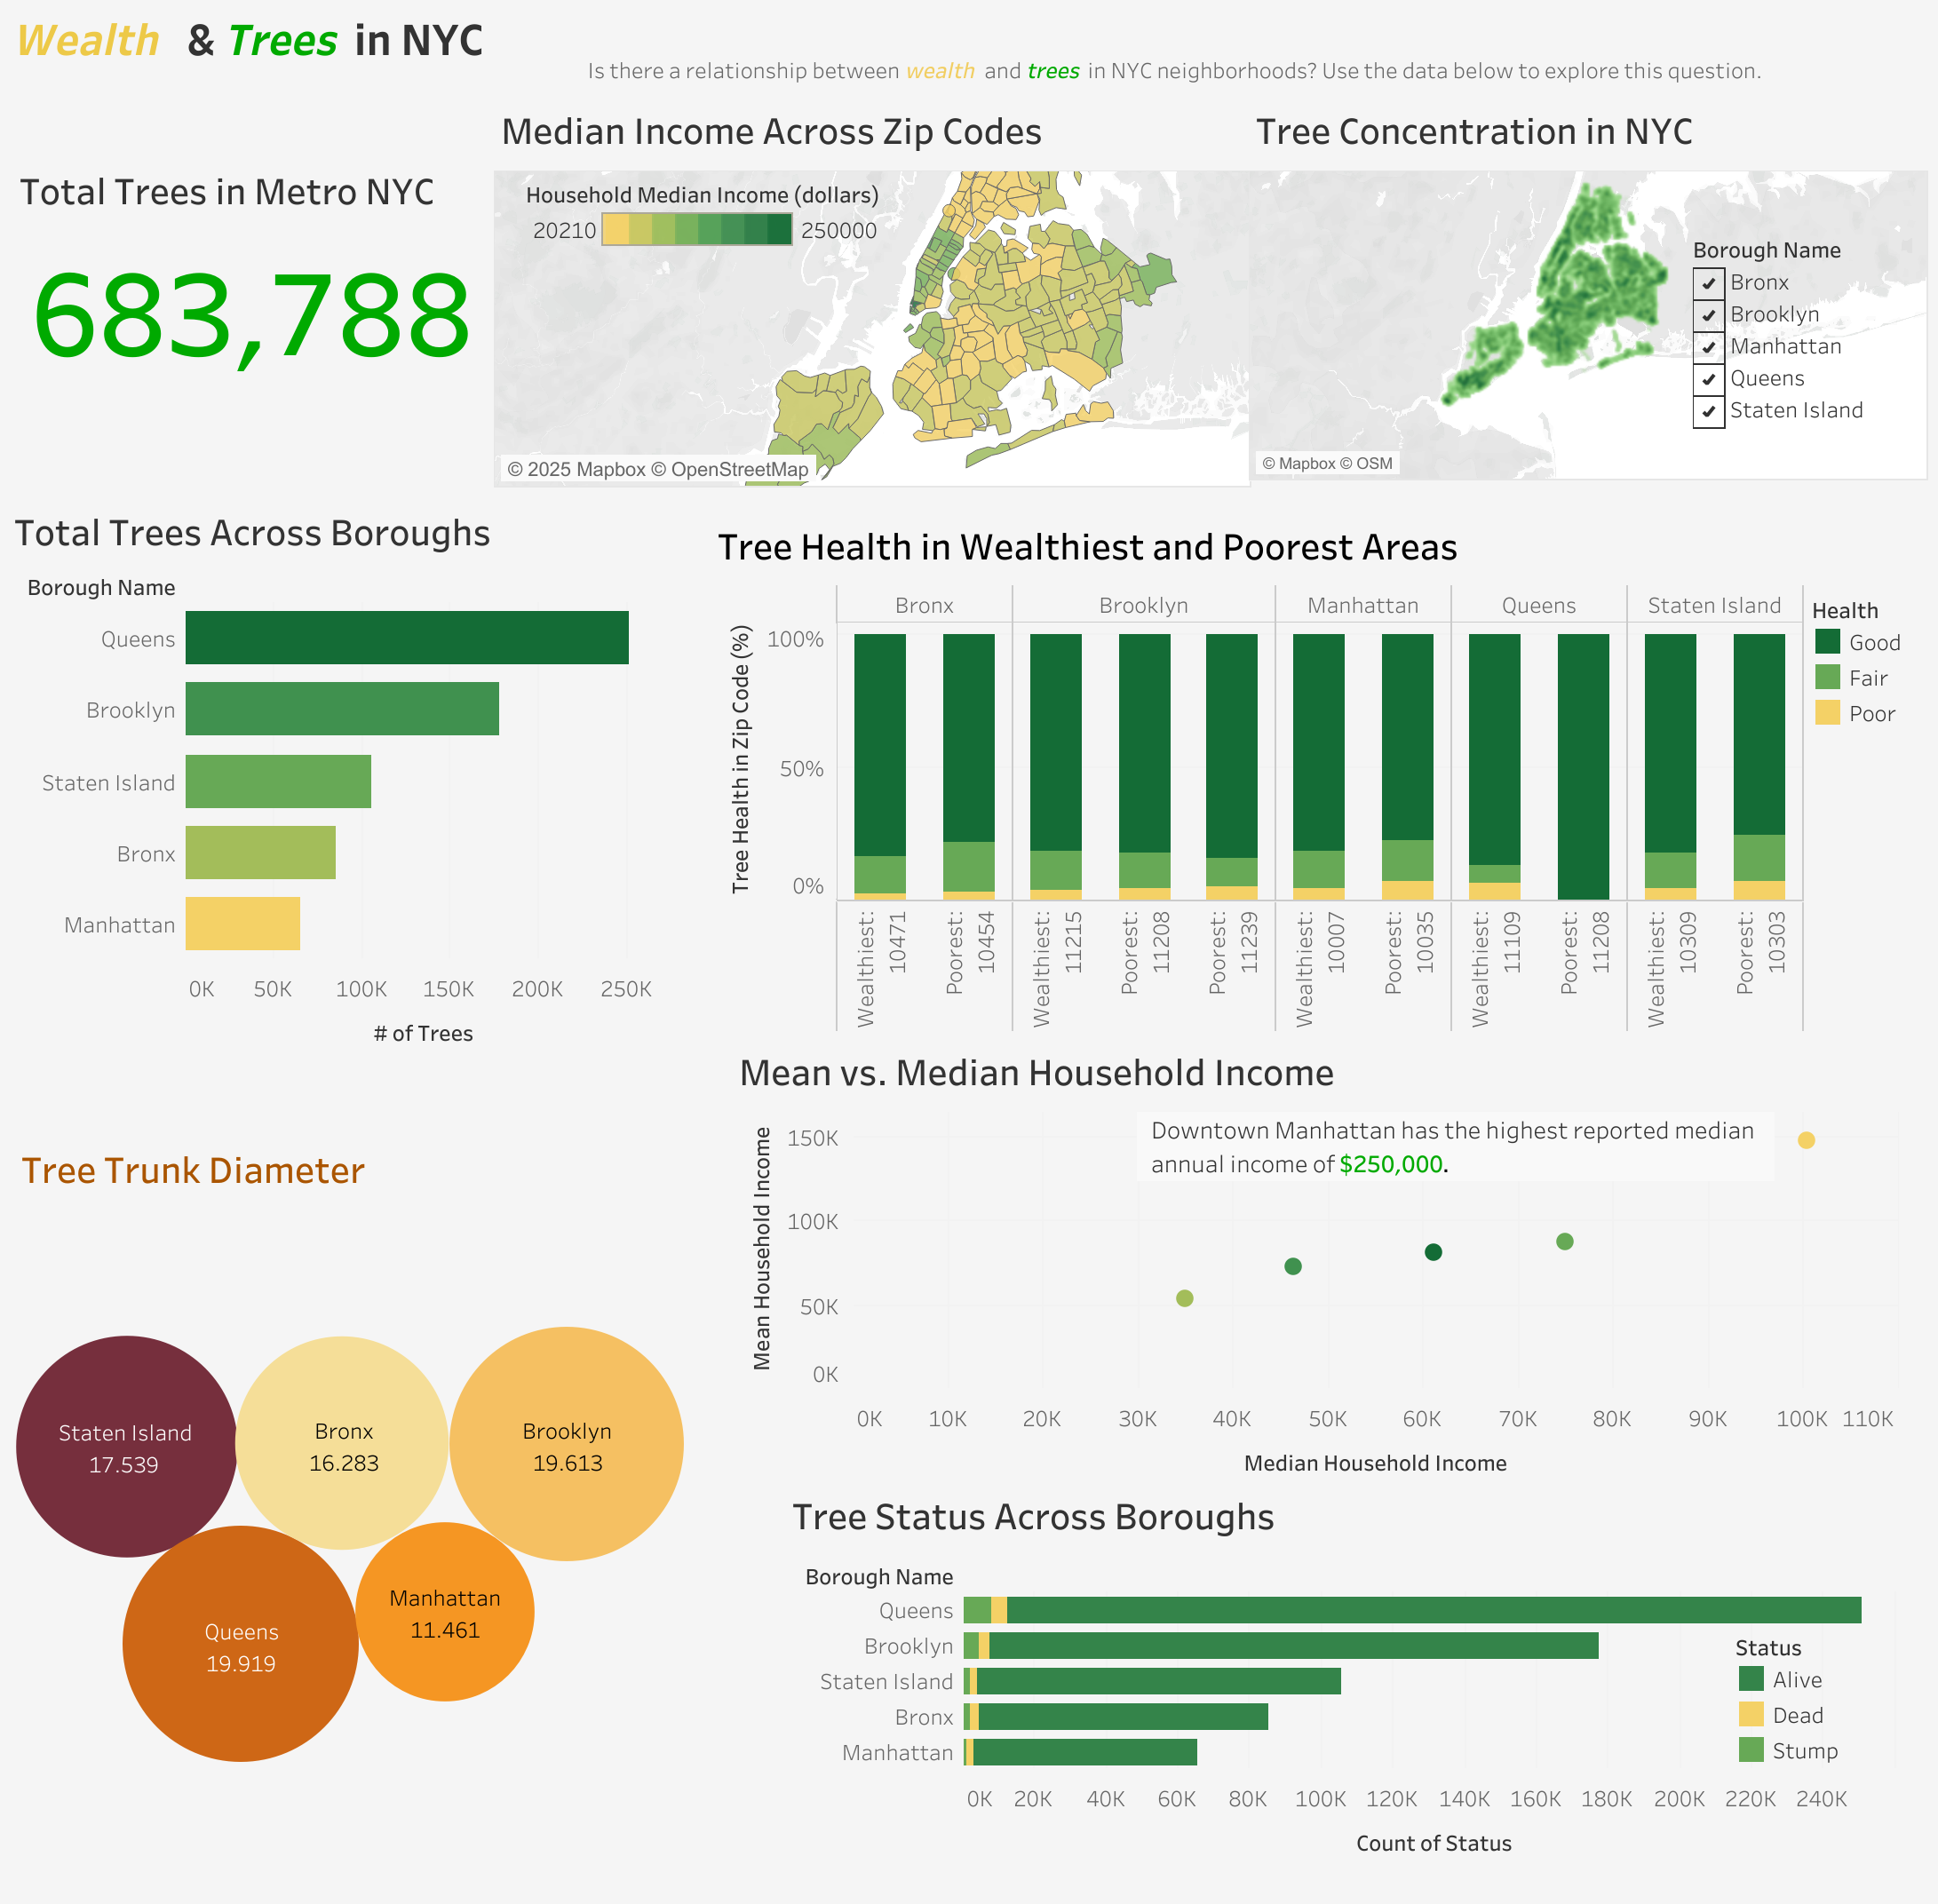
Tableau dashboard exploring the relationship between wealth and tree coverage across NYC's five boroughs, visualizing 680K+ trees with interactive maps, bar charts, and bubble charts.
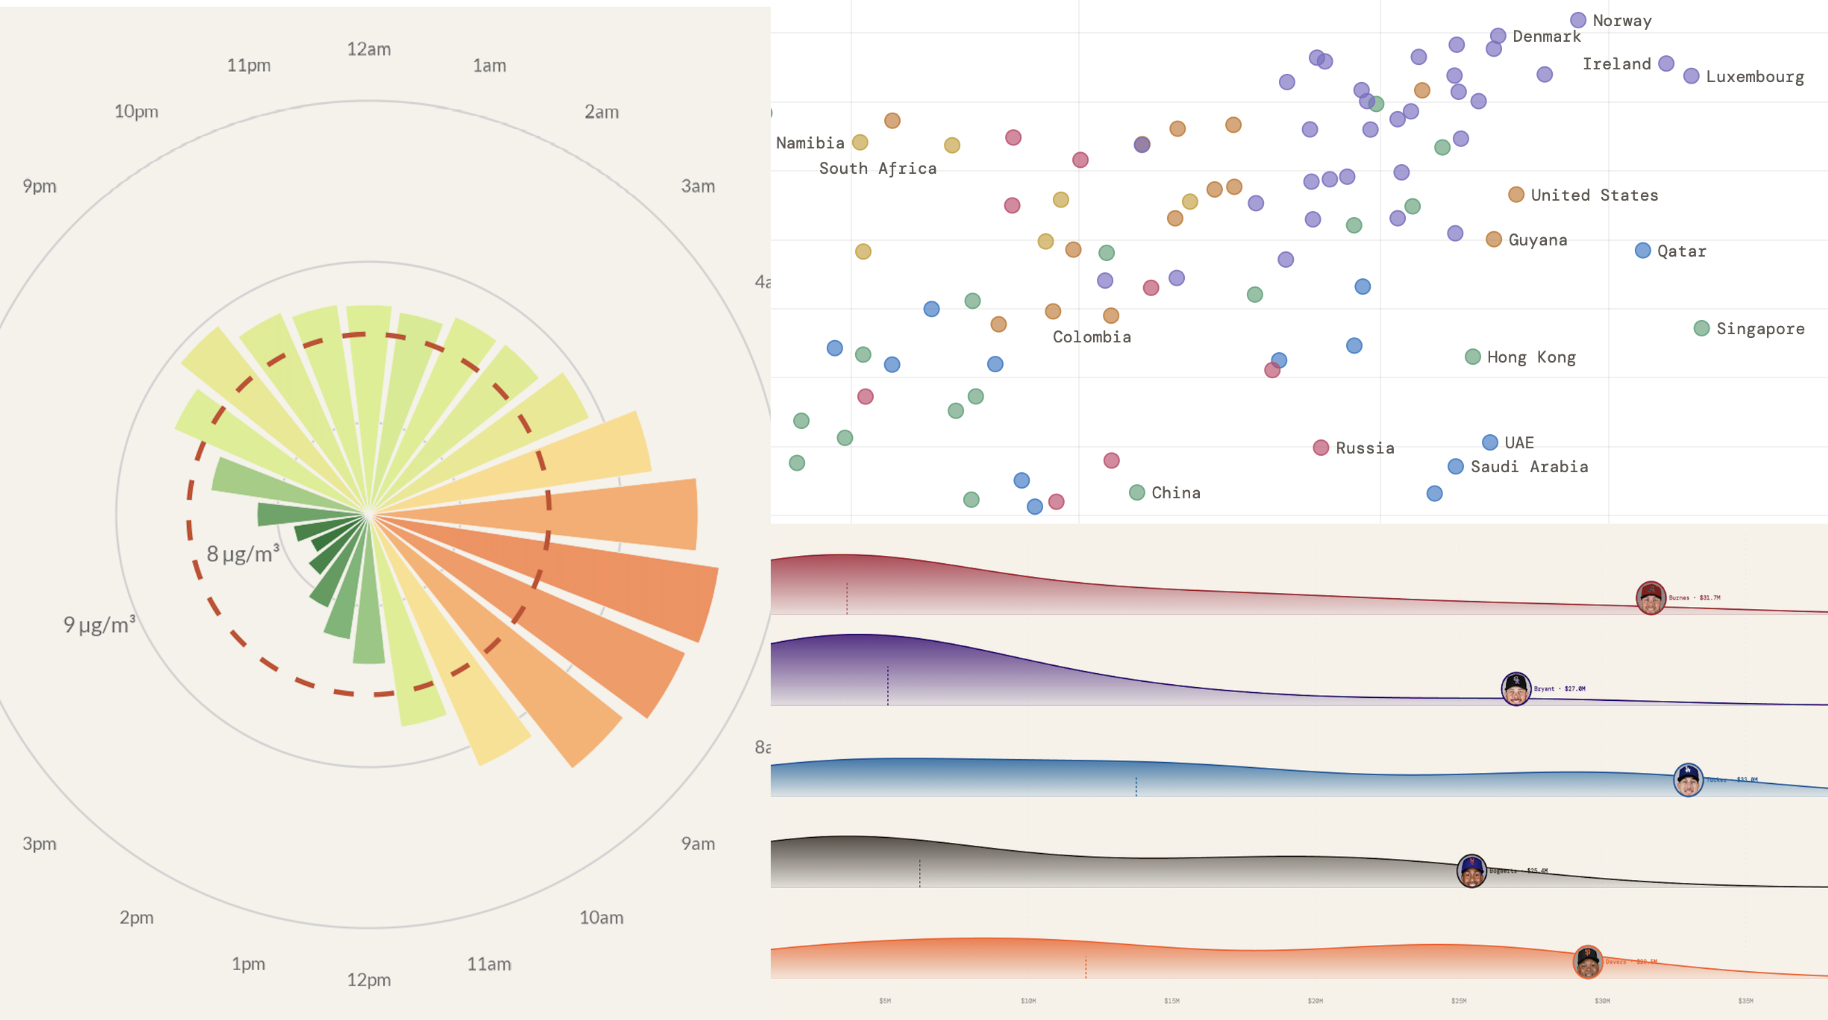
A collection of data visualizations created for each day of the month in April 2026.
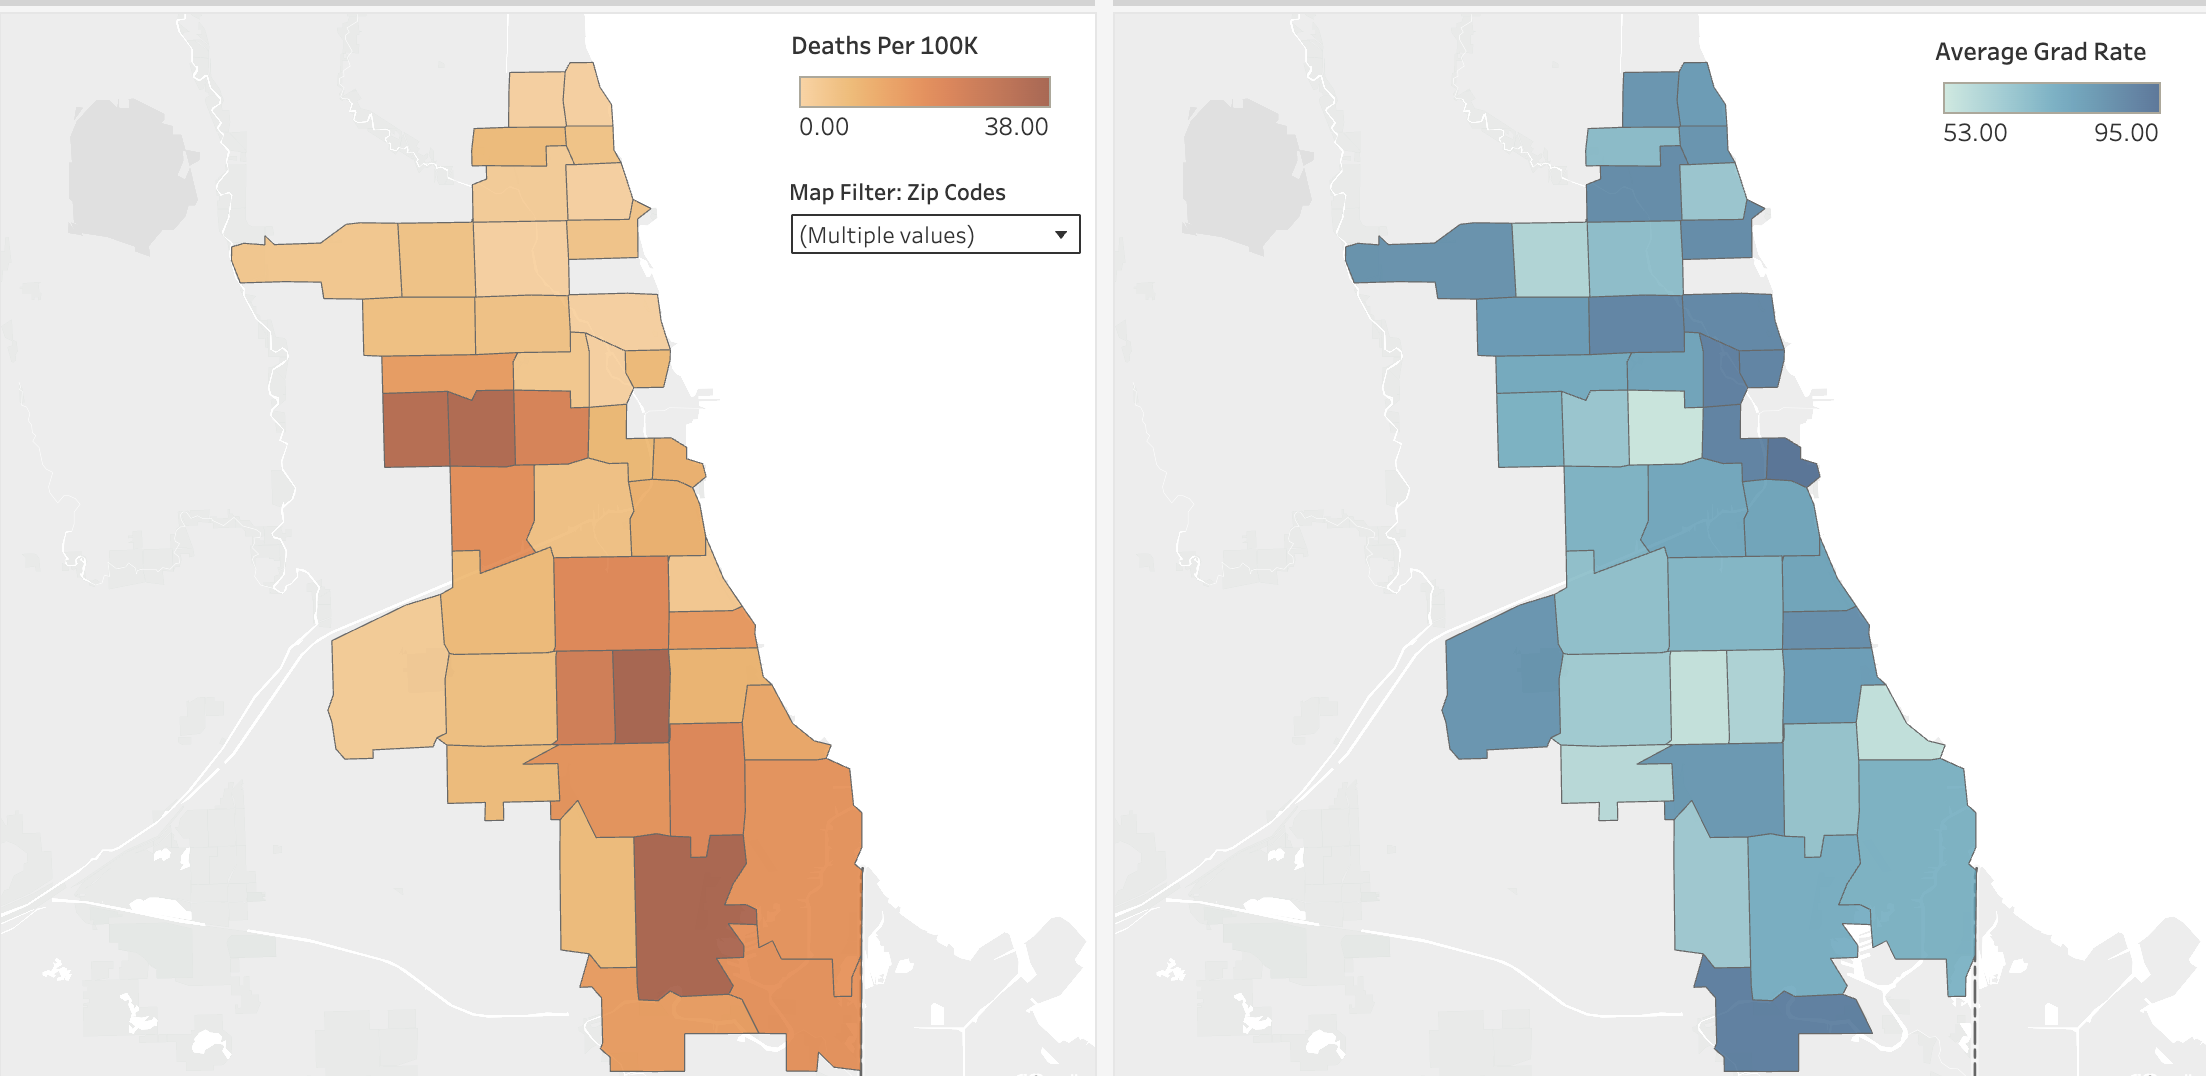
R regression analysis exploring the statistically significant inverse relationship between juvenile gun deaths and high school graduation rates across Chicago ZIP codes (2018–2021), visualized in Tableau.
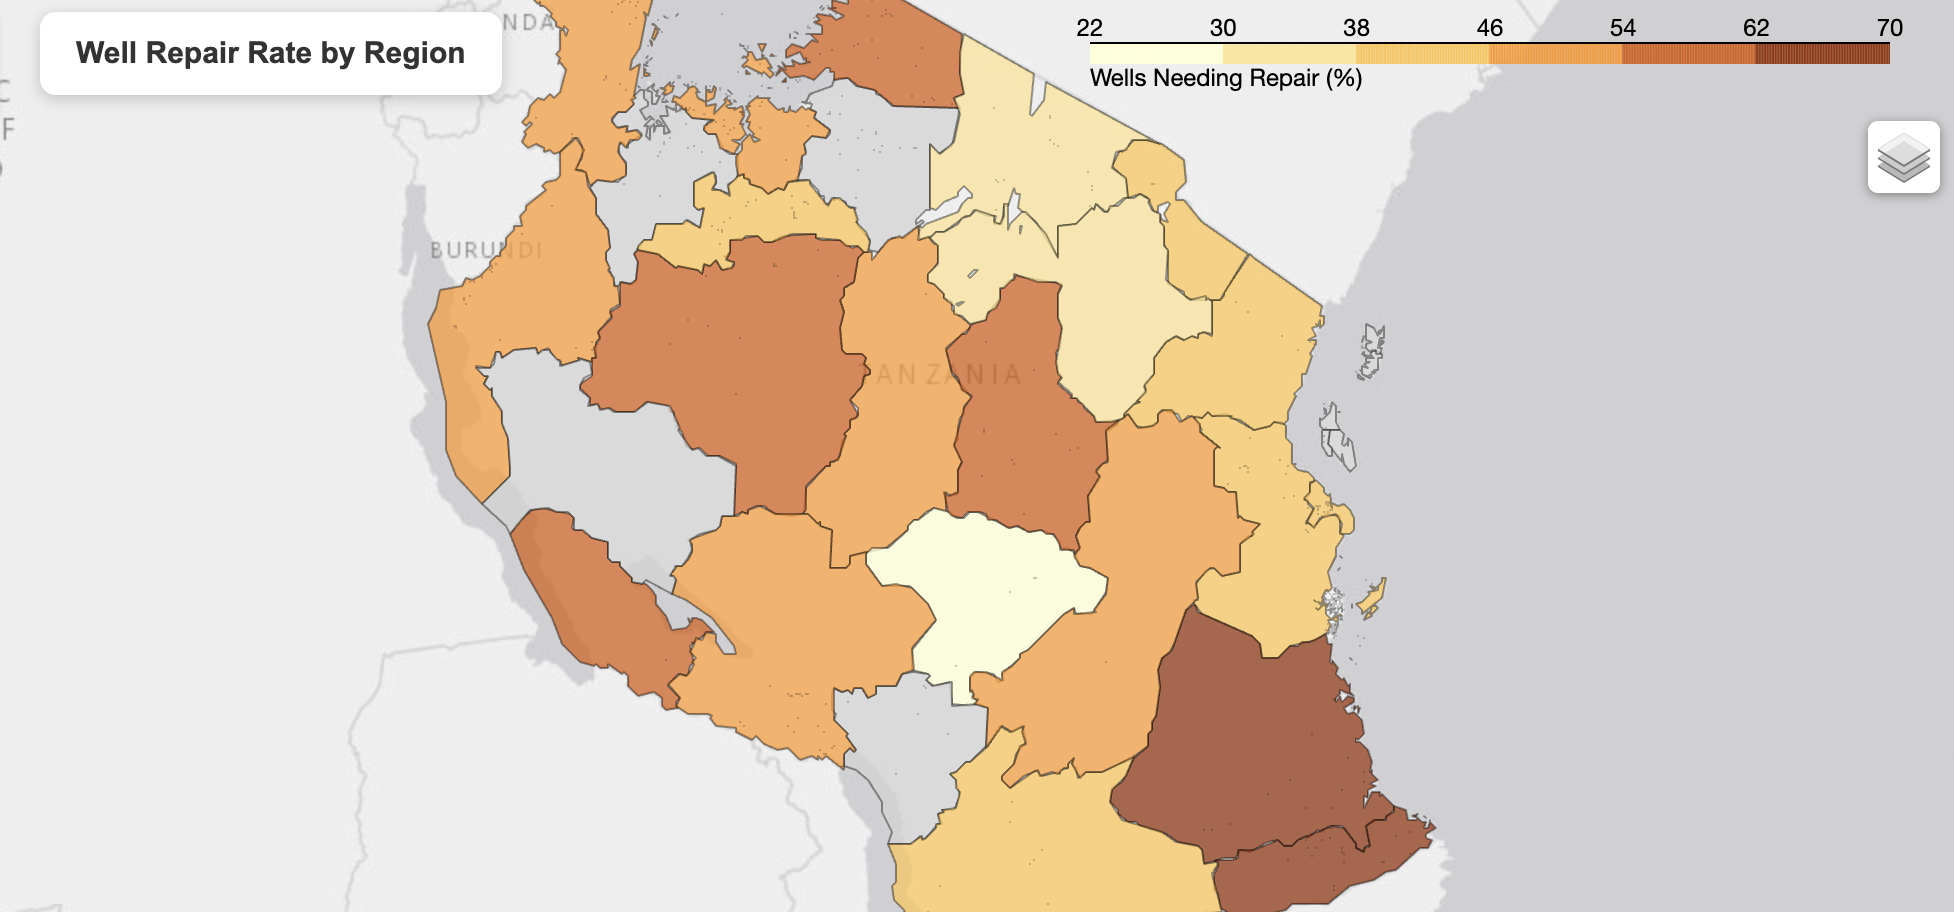
ML classification model predicting water well functionality from ~60K entries. Used Random Forest with GridSearchCV and Recursive Feature Elimination, achieving 78% recall with only 9.7% false negatives.
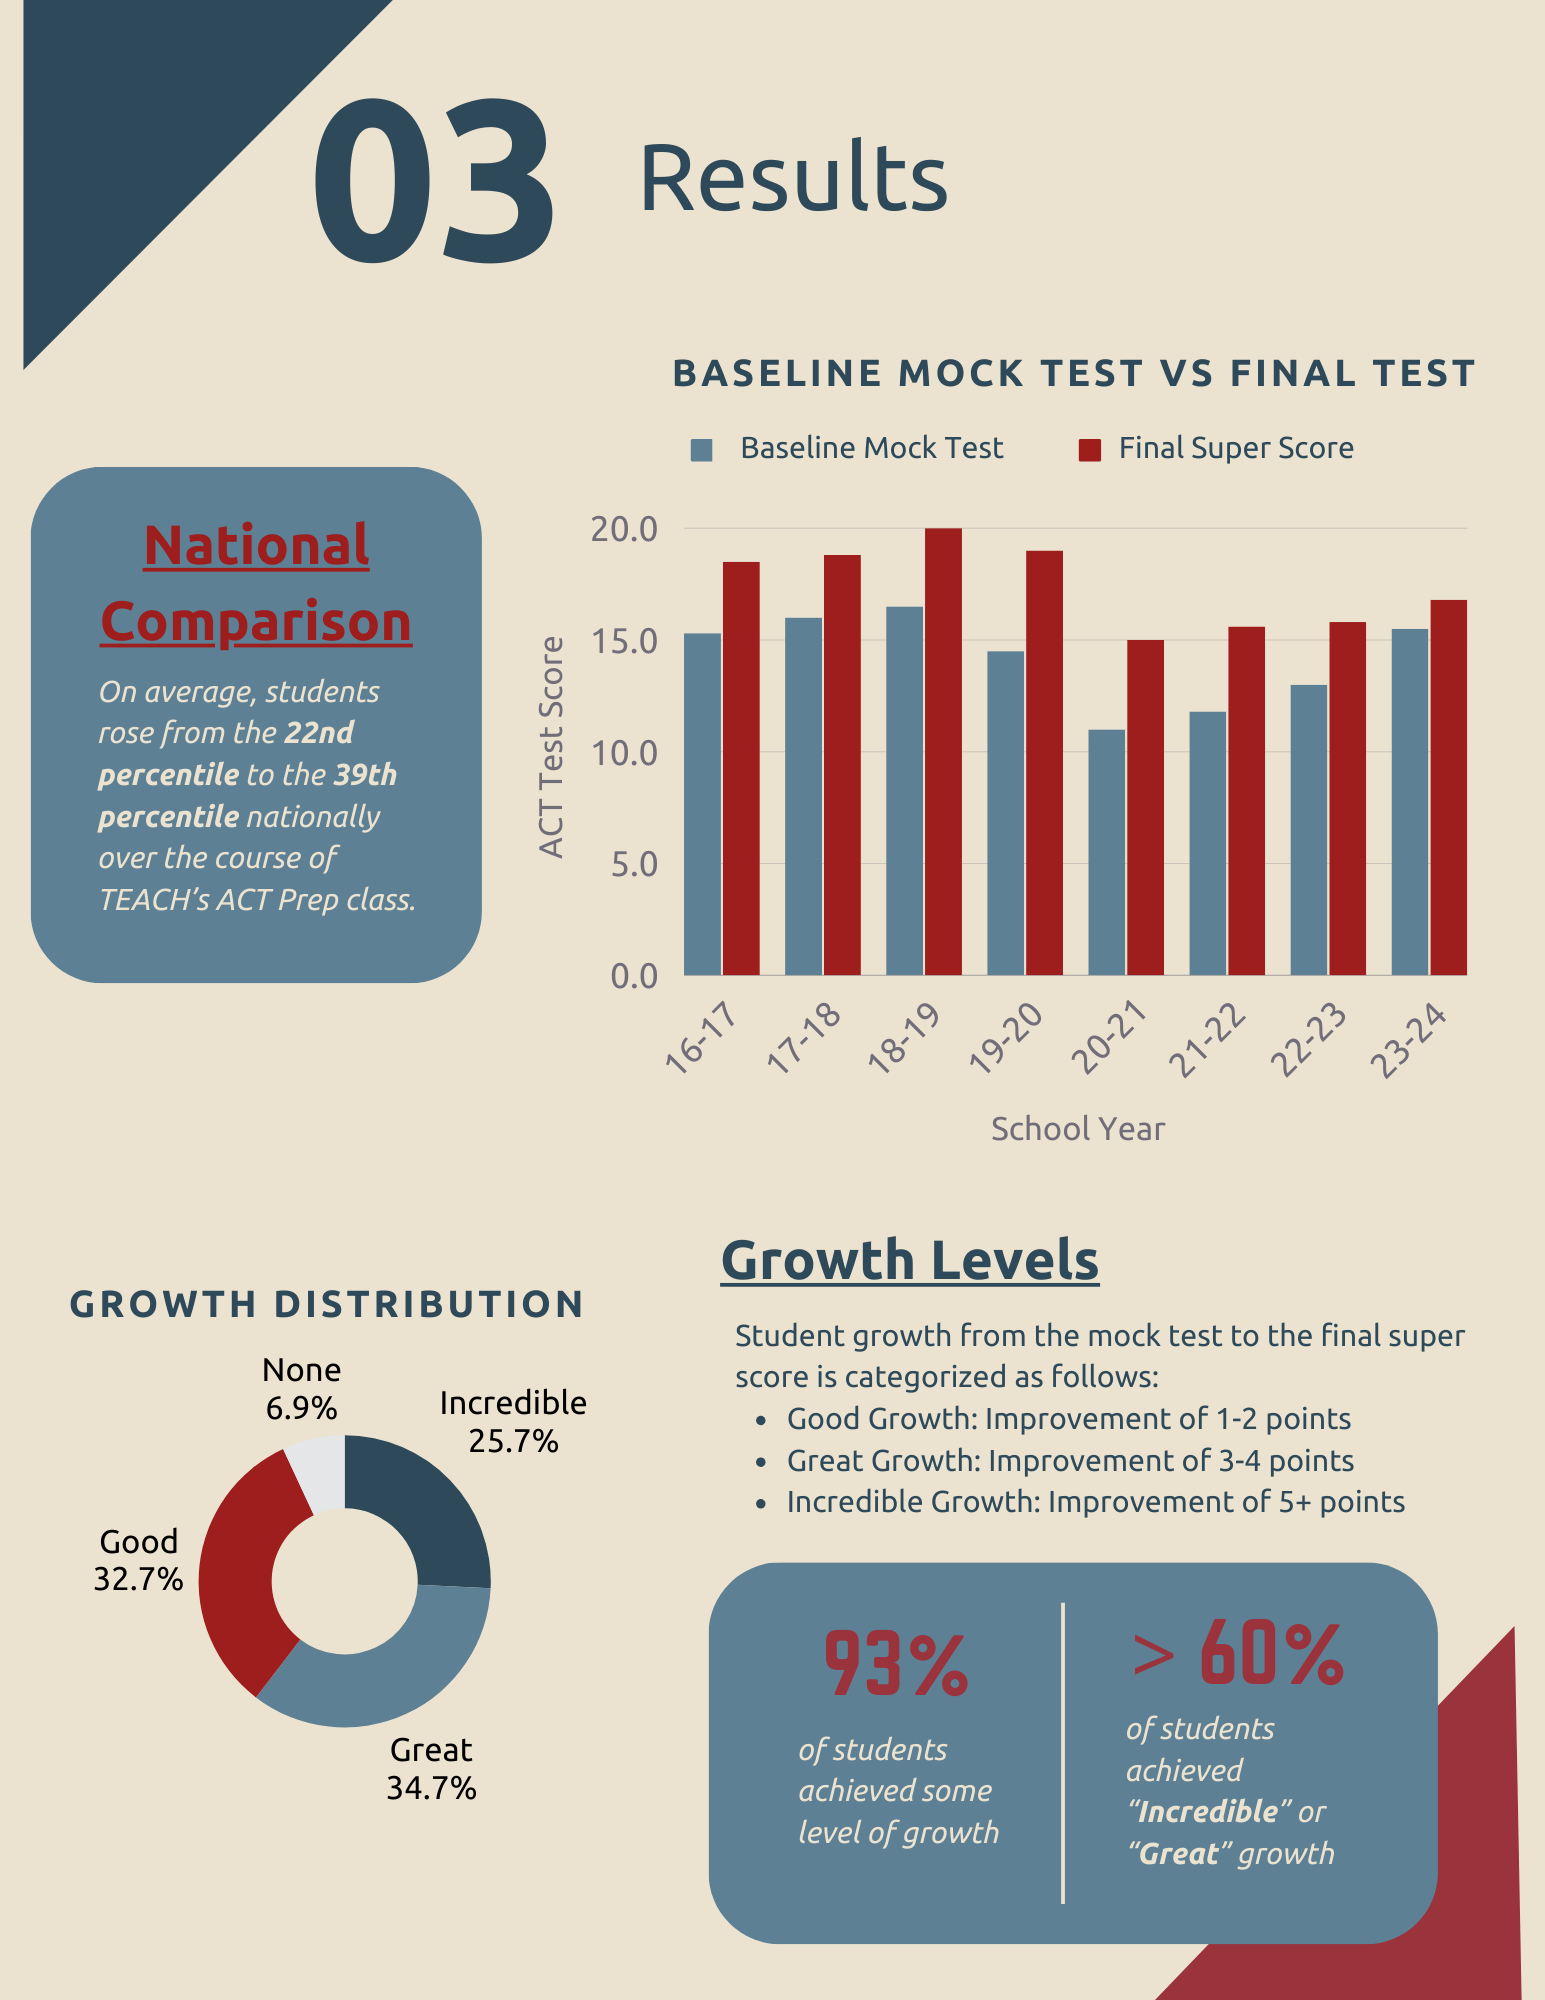
Comprehensive data analysis of 8 years of high school ACT performance to evaluate program effectiveness, producing a detailed report with key findings for instructional leadership.
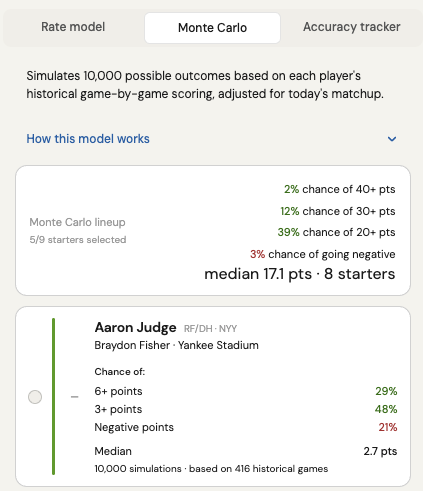
A daily projection tool that automatically fetches real MLB data and runs two independent models — a Rate model and a Monte Carlo simulation (10,000 outcomes) — to generate personalized lineup projections each morning via GitHub Actions.
Education



Writing

Foundations of causal thinking for data analysis, understanding cause vs. correlation in practice.
→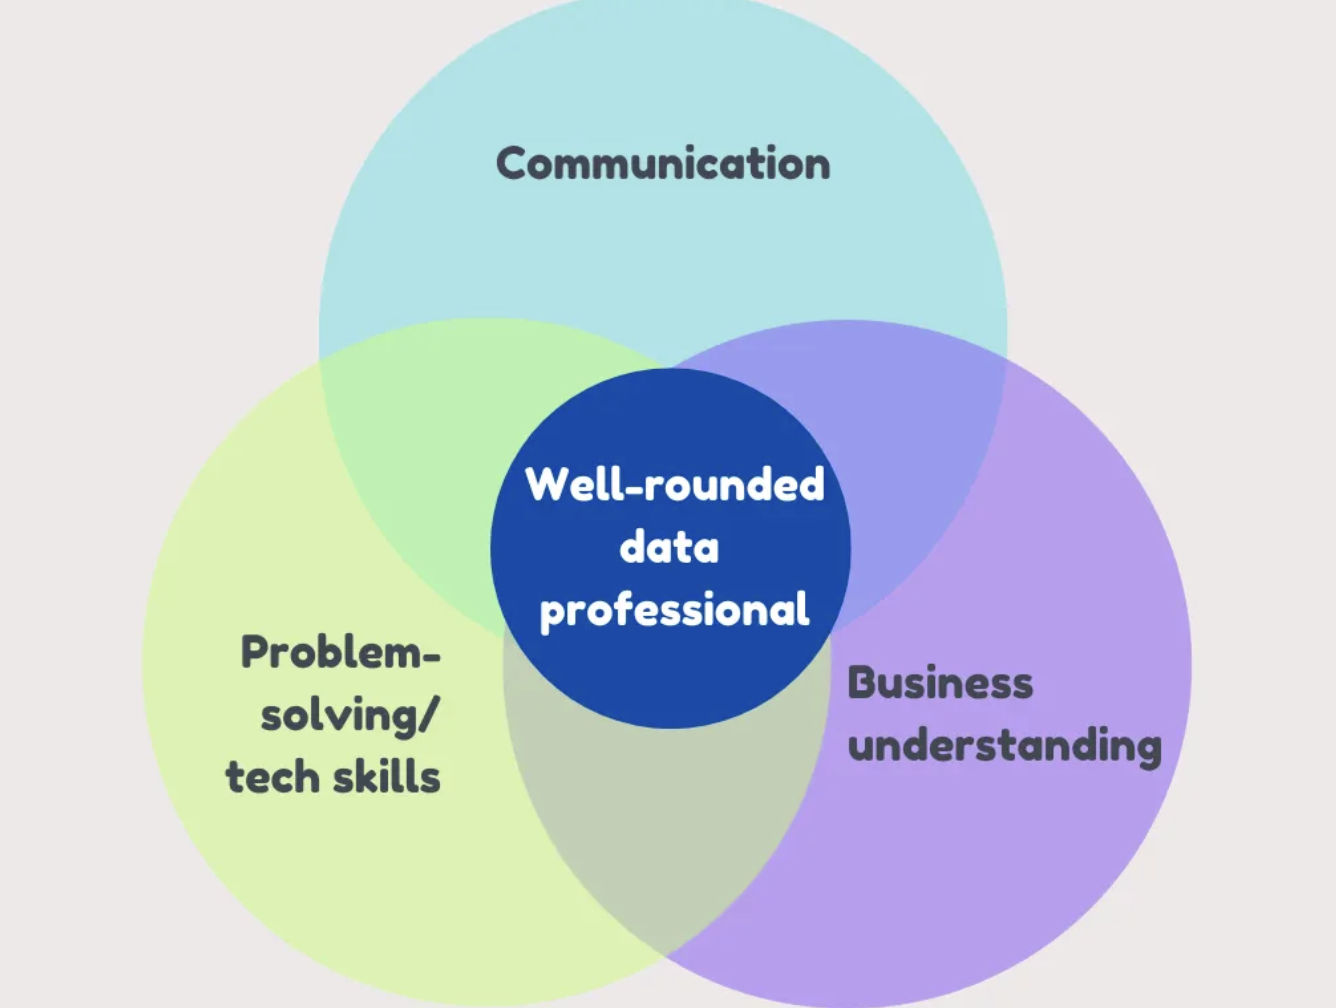
Key takeaways from my first quarter of an applied data fellowship.
→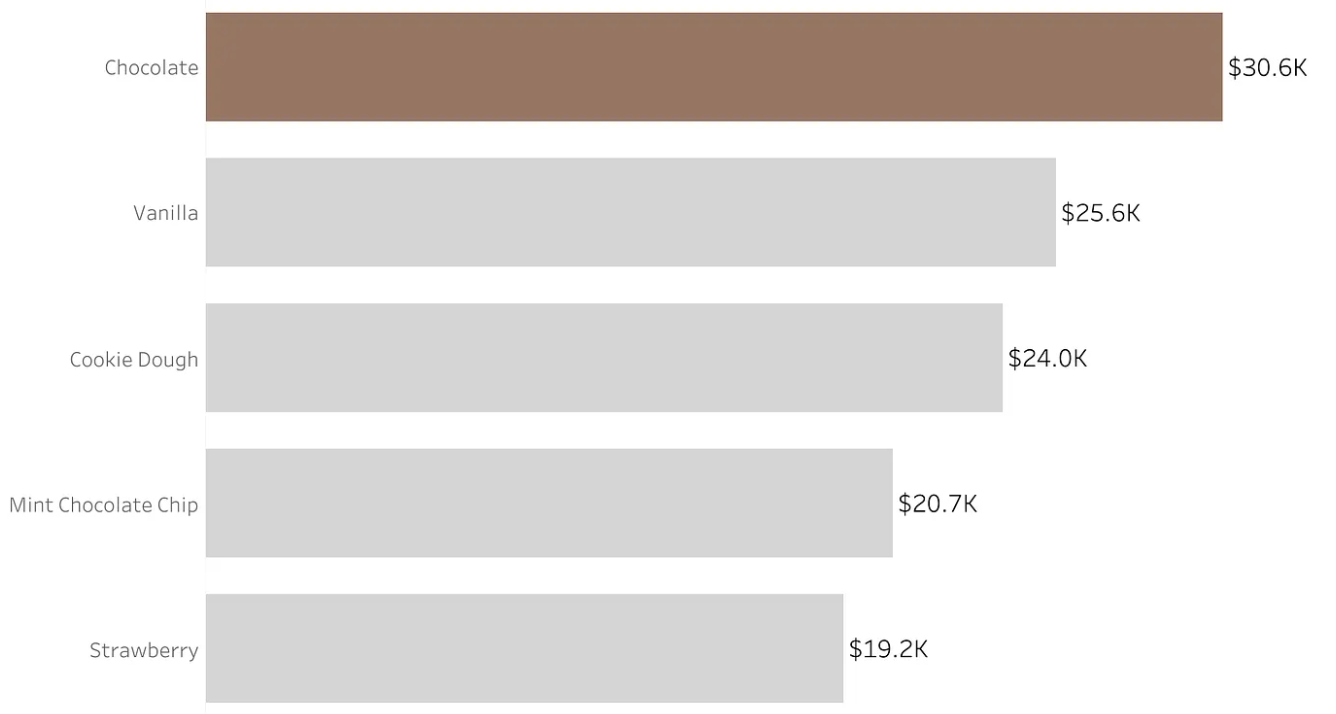
Key data visualization strategies for clear and impactful communication.
→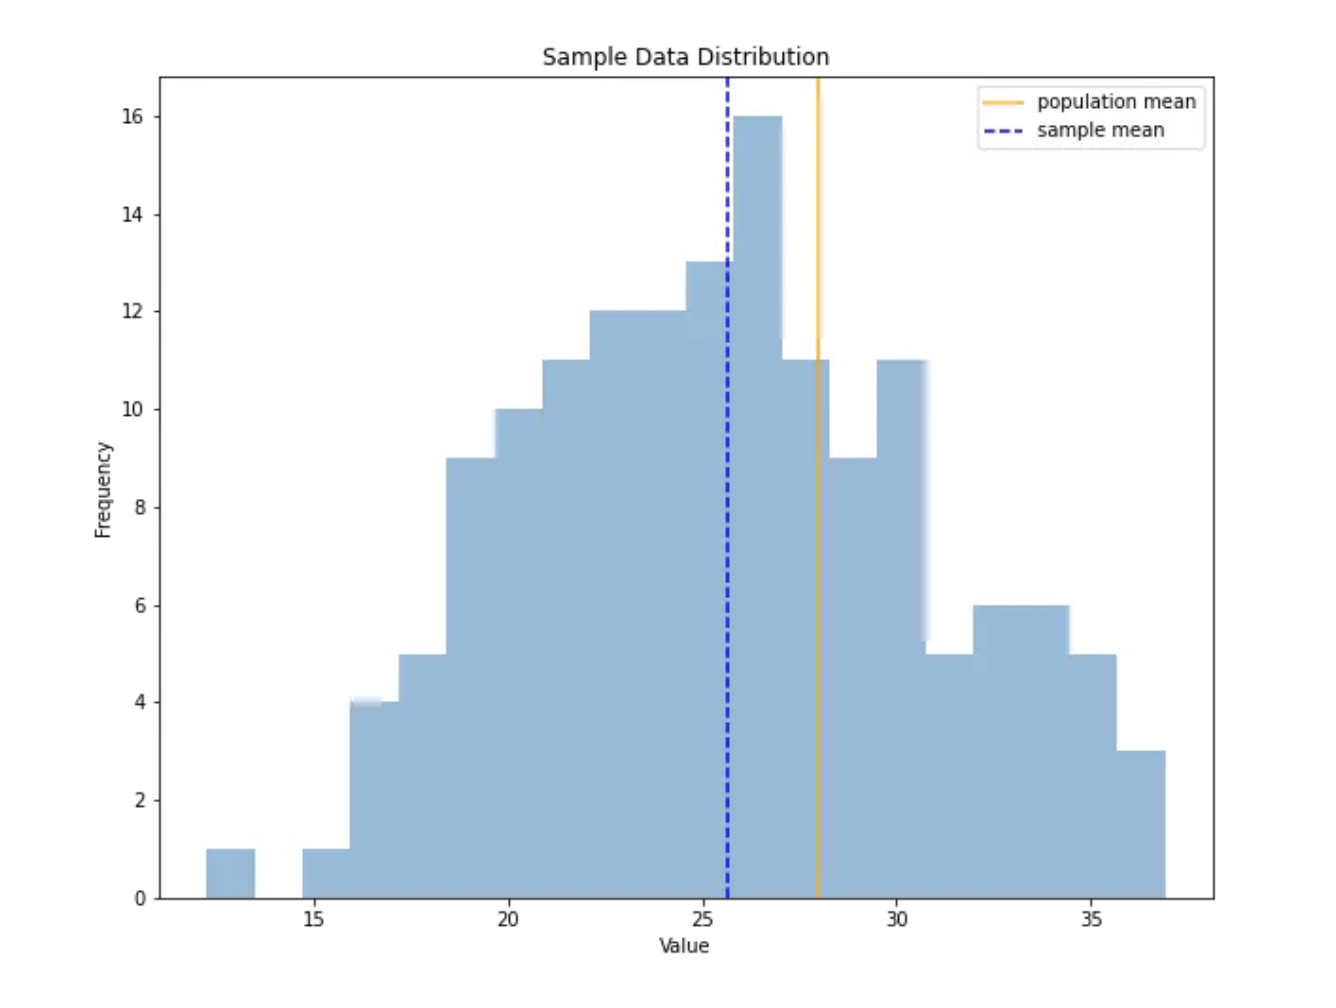
A beginner's guide to conducting and interpreting hypothesis tests with Python.
→
After years teaching high school math, here's what's really tripping up calculus students — and it's not the calculus.
→
Lessons from 'Palaces for the People' on social infrastructure, inequality, and what holds democracy together.
→Get in touch
Have a question, a project idea, or just want to connect? Feel free to reach out.