Data Analysis · Chicago · 2001–2024

Does How Chicago Spends Its Budget Predict Crime?

A regression analysis of city budget allocations and crime rates across two decades — and what the data actually shows.

2001–2024Years of Data 8City Departments 6Crime Outcomes 2Model Specifications

The Question Behind the Numbers

Public debates about crime in Chicago often center on how the city spends its money. This project asks what the data says.

The Police Funding Argument

More officers on the street means faster response times, greater deterrence, and lower crime. Proponents argue that cutting police budgets puts communities at risk.

The Social Investment Argument

Thinkers from Martin Luther King Jr. to Angela Davis have argued that addressing root causes of crime — poverty, housing instability, lack of opportunity — is more effective than policing.

What This Project Does

Using publicly available budget and crime data from 2001 to 2024, this analysis examines whether changes in departmental spending shares are statistically associated with changes in crime rates.

What This Project Can't Do

Observational data over 24 years cannot establish causation. Budget decisions happen alongside economic shifts, demographic changes, and federal policy — all of which also influence crime.

What the Data Shows

Budget shares correlate with crime at first glance — but most of those correlations have a simpler explanation.

Finding 01

Most correlations are driven by a shared time trend

Crime in Chicago declined substantially from 2001 to 2024, and budget compositions shifted over the same period. When year is controlled for, most budget-crime correlations disappear — suggesting they reflect parallel trends, not independent relationships.

Finding 02

Police, human services, and library shares don't hold up

Despite high bivariate R² values (0.72–0.81), police funding share, human services share, and library share all lose statistical significance once the time trend is accounted for. The data does not support strong independent claims about any of these.

Finding 03

Two predictors survive year control

Streets & Sanitation share and CPS state funding share retain statistically significant associations with crime after controlling for year — though both in positive directions that are difficult to interpret causally, and may reflect socioeconomic proxies rather than direct effects.

Finding 04

Homicides are the hardest outcome to predict

Homicide rates — the most reliably reported crime type and least susceptible to detection bias — show the weakest associations with budget variables across all model specifications. No budget predictor significantly predicts homicide rates after controlling for year.

Exploring the Data

How crime rates and budget allocations have changed across two decades in Chicago.

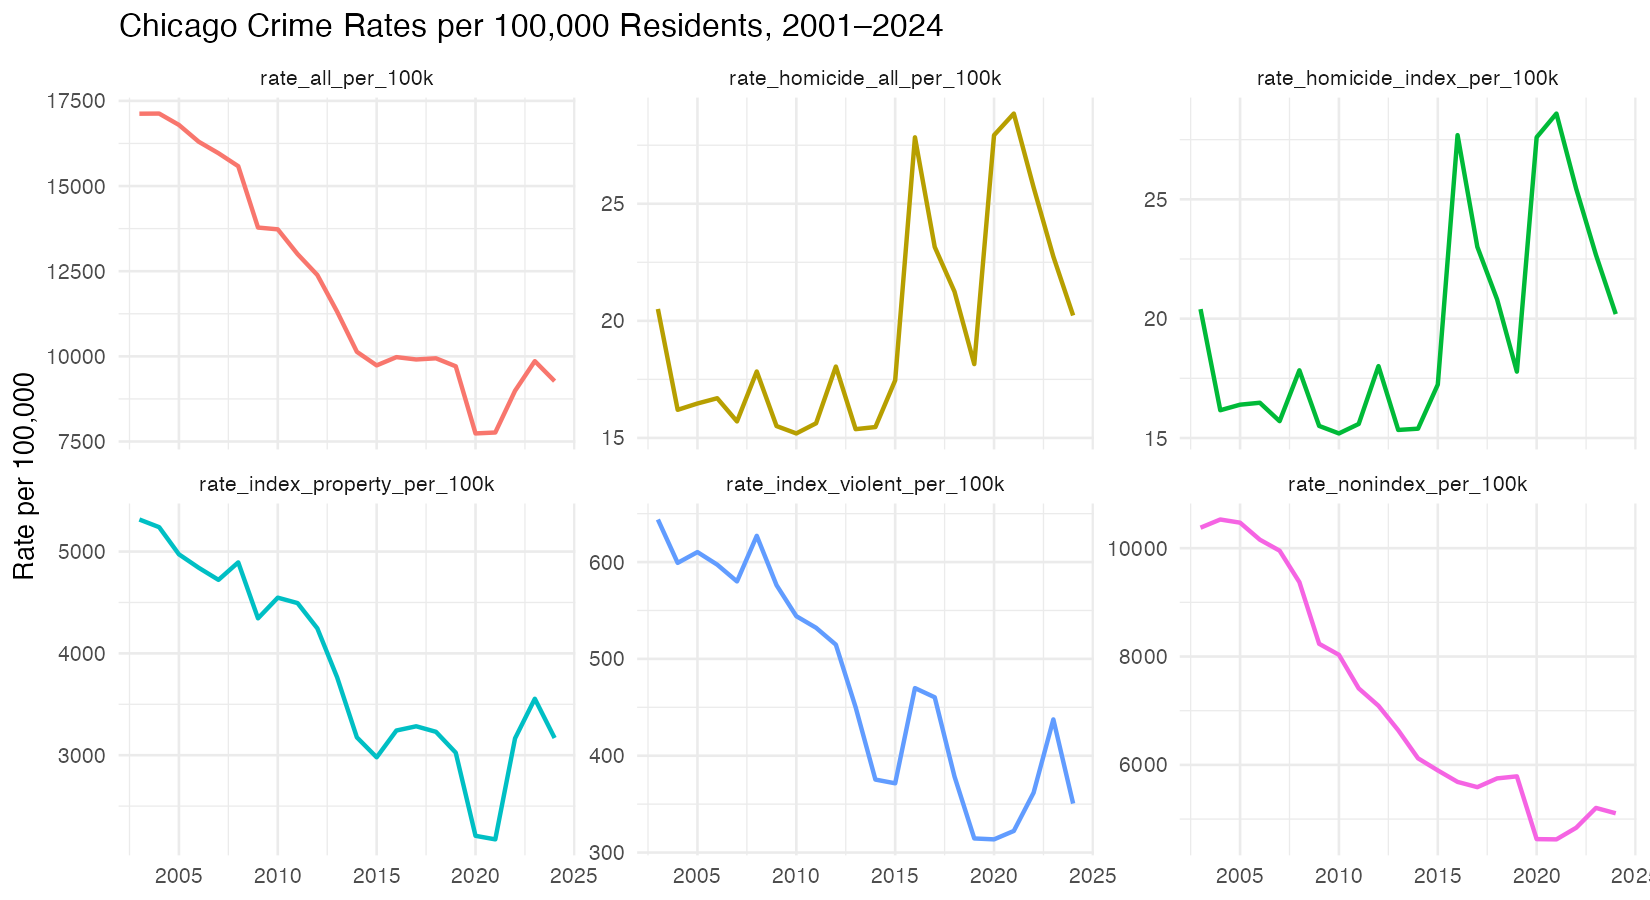
Crime Rate Trends, 2001–2024

All crime types declined substantially over the study period, with the steepest drops in property and non-index crime. Homicide rates followed a different trajectory, rising sharply around 2016 before declining again.

Crime rate trends in Chicago 2001–2024
Crime rates per 100,000 residents, 2001–2024. Source: Chicago Police Department Open Data Portal.

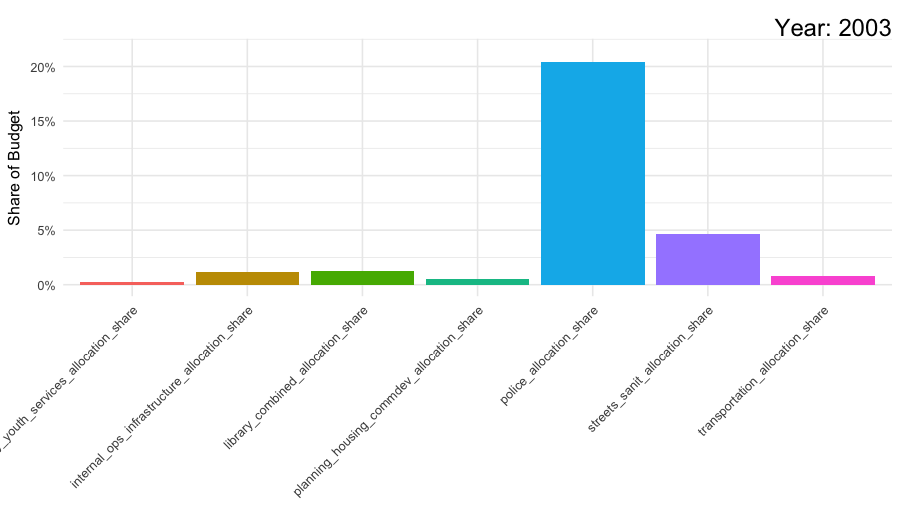
How Budget Shares Shifted Over Time

The city's spending priorities changed significantly across two decades. Police maintained the largest share throughout, while the relative weight of human services, housing, and infrastructure shifted year by year.

Animated chart of Chicago budget shares by department 2001–2024
Share of total city budget by department, 2001–2024. Inflation-adjusted to 2024 USD. Source: Chicago City Clerk Annual Appropriation Ordinances.

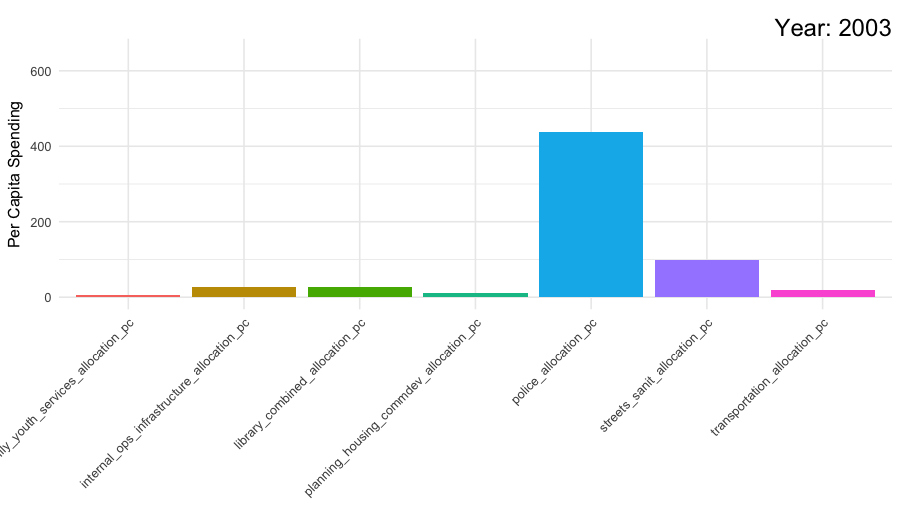
Per Capita Spending by Department

Expressed in inflation-adjusted dollars per resident, overall spending grew across most departments over the period — even as population declined and budget shares shifted.

Animated chart of Chicago per capita spending by department 2001–2024
Per capita city spending by department, 2001–2024. Inflation-adjusted to 2024 USD. Source: Chicago City Clerk Annual Appropriation Ordinances.

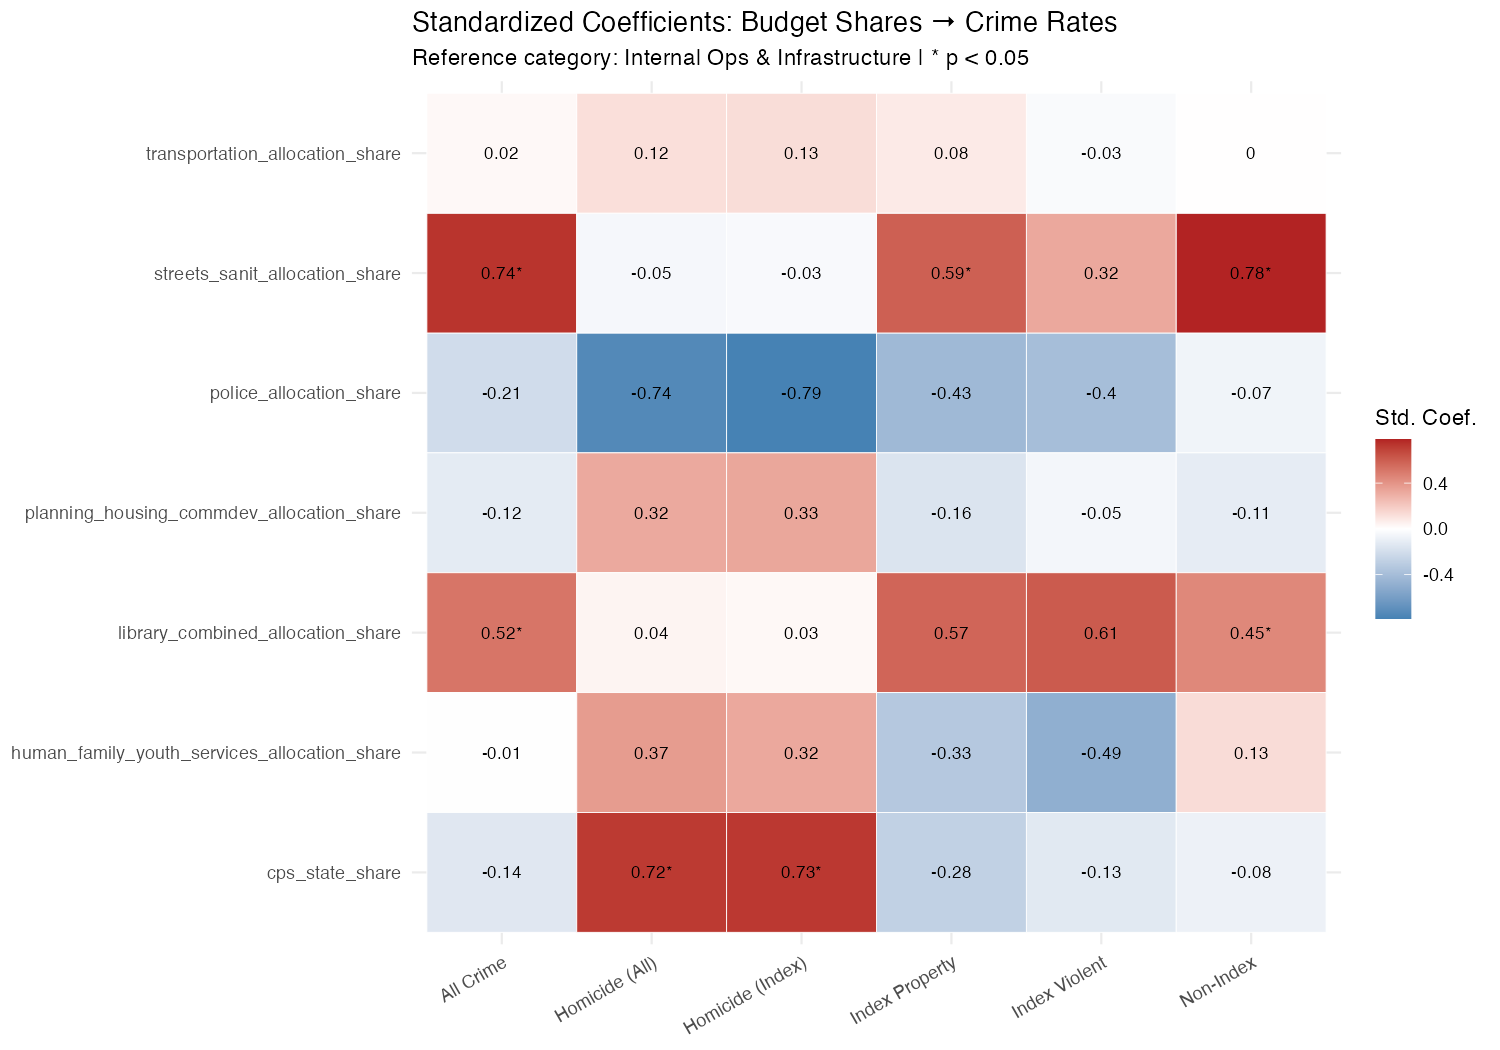
Which Budget Categories Are Most Associated with Crime?

Standardized regression coefficients show the direction and relative strength of association between each budget share and each crime outcome, controlling for all other predictors. Red indicates a positive association (higher share, higher crime); blue indicates a negative association. Asterisks mark statistically significant relationships.

Heatmap of standardized regression coefficients for budget shares and crime rates
Standardized (beta) coefficients from multivariate OLS regression. Reference category: Internal Operations & Infrastructure. * p < 0.05. Interpret with caution — high multicollinearity (VIF = 9–16) among several predictors.

How the Analysis Was Done

A multi-step pipeline from raw public data to regression models, with careful attention to common pitfalls in budget-crime analysis.

Step 01

Data Assembly

Budget data from Chicago City Clerk records, crime incidents from the CPD Open Data Portal, population from the U.S. Census, and CPI from the BLS were assembled into a single annual panel.

Step 02

Inflation Adjustment

All dollar values were converted to constant 2024 USD using annual CPI averages, ensuring year-over-year budget comparisons are not distorted by inflation.

Step 03

Crime Classification

Incident-level crime records were classified using FBI UCR Index codes into violent, property, and non-index categories. Homicides were flagged separately as a reporting-bias robustness check.

Step 04

Normalization

Budget figures were expressed both as share of total city budget and as inflation-adjusted per capita spending. Crime counts were converted to rates per 100,000 residents.

Step 05

Regression Modeling

Bivariate OLS models (one predictor at a time) served as the primary analysis, chosen to avoid multicollinearity issues. Full multivariate models were run as a secondary robustness check.

Step 06

Year Sensitivity Check

All models were re-run with calendar year as a covariate to identify which budget-crime associations survive after accounting for the overall time trend in both variables.

Full methodology, including data cleaning decisions, interpolation approach, and regression diagnostics, is documented in the project repository.

→ View full methodology and code on GitHub

Where the Data Comes From

All data used in this analysis is publicly available.

Crime Data (2001–2024)

Chicago Police Department via City of Chicago Open Data Portal. Incident-level records with IUCR crime classifications.

City Budget Data

Chicago City Clerk Annual Appropriation Ordinances. Department-level allocations from 2001–2024.

CPS Budget Data

Chicago Public Schools Annual Budget Reports. State funding as a share of total CPS revenue.

Population Data

U.S. Census Bureau via tidycensus. Decennial counts, ACS 1-year estimates, and post-2020 Population Estimates Program data.

Inflation (CPI-U)

U.S. Bureau of Labor Statistics. All Urban Consumers, U.S. City Average. Annual averages used for adjustment to 2024 USD.