A public-facing impact report delivering district-level performance metrics across Cook County's 17 commissioner districts, built from data collected across dozens of county departments.
Overview
Cook County is the second largest county in the United States, serving over 5 million residents across 17 commissioner districts. Despite a wealth of program and service data collected across dozens of departments, there was no unified, public-facing resource that showed constituents what their county was actually doing in their district.
The Cook County District Overview Report was created to fill that gap, and was the first report of its kind at this scale out of Cook County. A set of 17 individual district reports totaling 527 pages, its primary goal was to communicate directly to constituents the investments and work the county was doing in each of their districts. No public-facing report had previously broken down county performance data at the commissioner district level.
The Challenge
The core challenge was that Cook County departments collect and report data independently, often at different geographic levels and in different formats. Some departments reported at the district level, but many only had data available at the ZIP code level. ZIP codes don't align cleanly with commissioner district boundaries, which required a custom aggregation approach.
Beyond the geographic mismatch, data arrived from over 20 department contacts in varying formats and with inconsistent definitions, requiring extensive auditing, cleaning, and standardization before any analysis could begin. There was no existing data pipeline or data dictionary to build from.
Methodology
Coordinated with 20+ department directors and data contacts across Cook County to define metrics, establish data collection templates, and gather raw program and service data. Created a data dictionary to standardize definitions across departments.
Conducted a comprehensive audit of all incoming data, documenting gaps, inconsistencies, and quality issues across departments. Produced a 10-page writeup including SOPs and recommendations for improving future data collection processes.
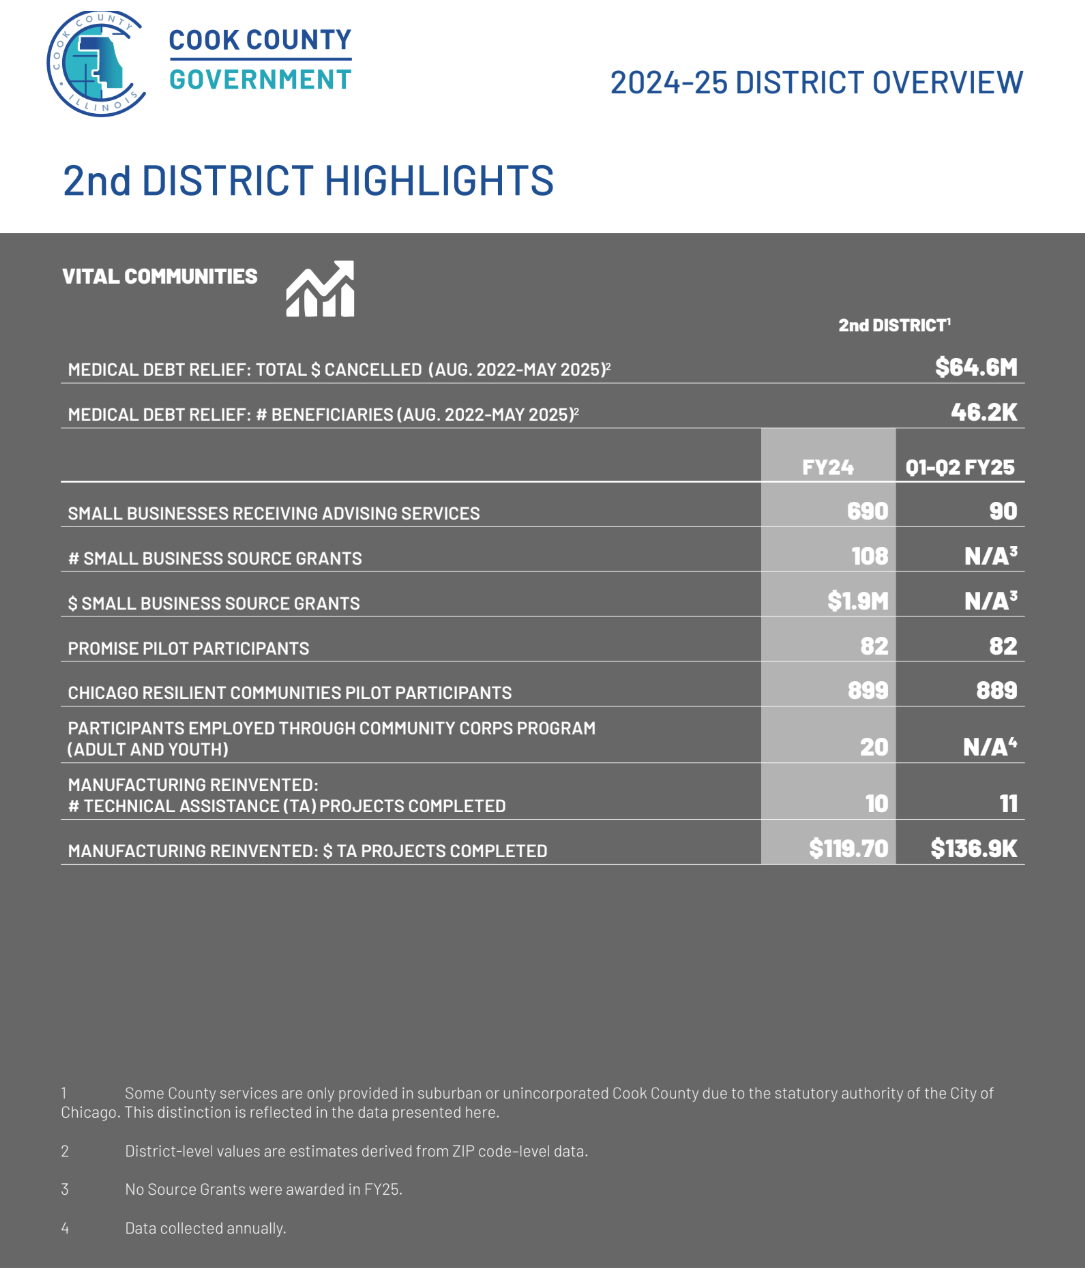
For metrics reported at the ZIP code level, applied a population-weighted aggregation methodology using U.S. Census Bureau population data to estimate district-level figures. This involved integrating ACS Census API data, ZIP-level datasets, and Cook County district shapefiles in Python to produce reliable, validated district-level metrics.
Built Python scripts to clean, standardize, and transform raw departmental data into a consistent format suitable for reporting. Applied QA checks throughout to ensure accuracy and consistency across all 17 district outputs.
Used Adobe InDesign to design and produce the final district reports, translating validated data into a visually compelling public-facing format. Each of the 17 district reports followed a consistent layout while surfacing metrics relevant to that district's geography and demographics.
As a one-year fellow, a key part of the role was ensuring the project could continue after my tenure ended. I created comprehensive documentation for my successor including step-by-step process guides, a metric dictionary, data collection SOPs, and an InDesign training to enable the next analyst to inherit and continue the reporting cycle independently.
Report Structure
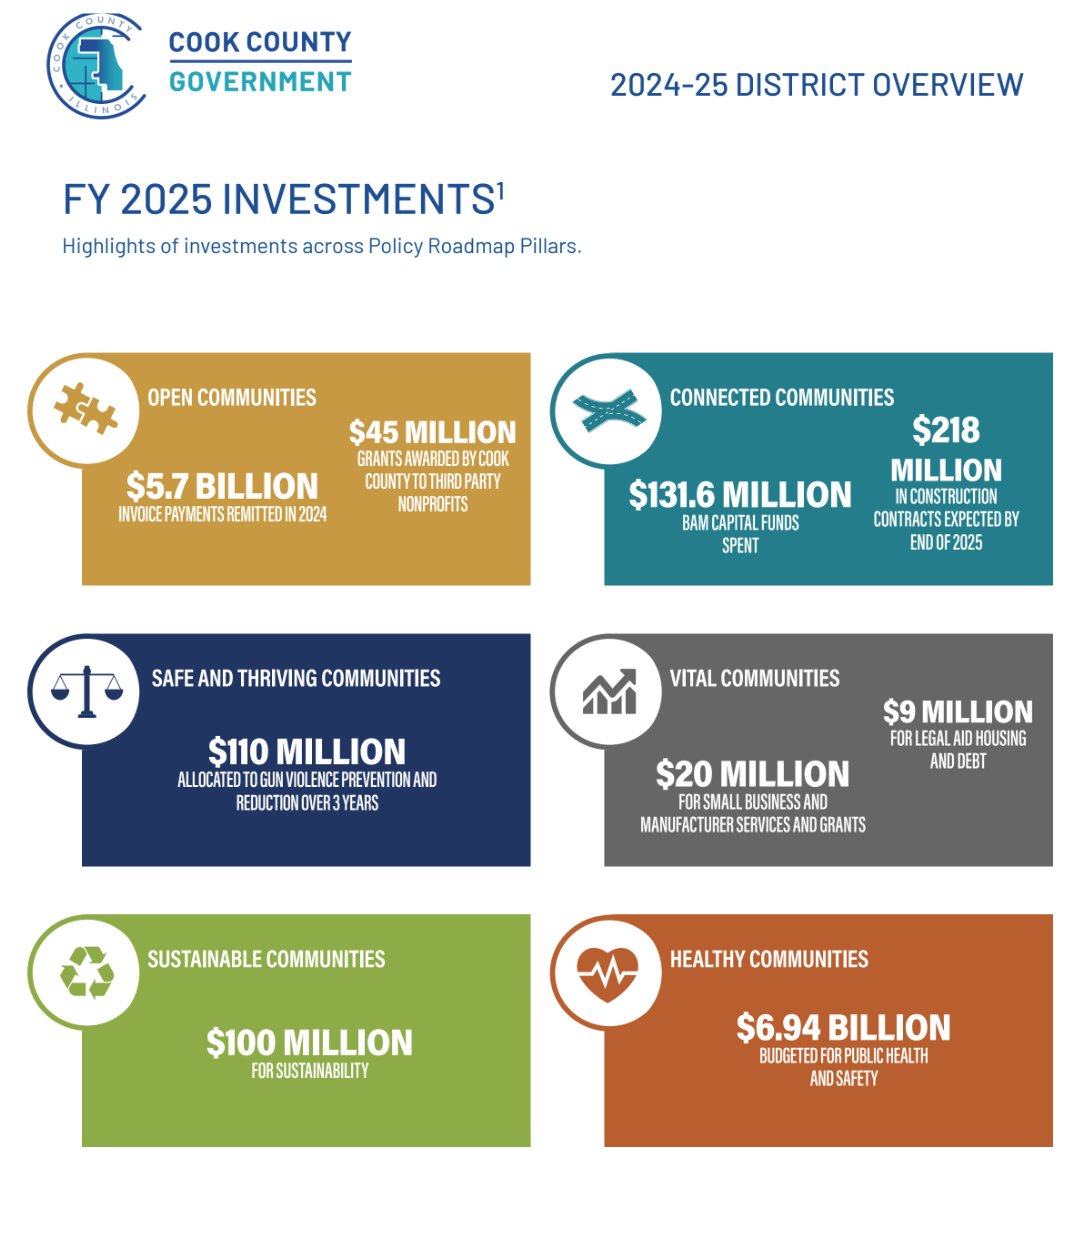
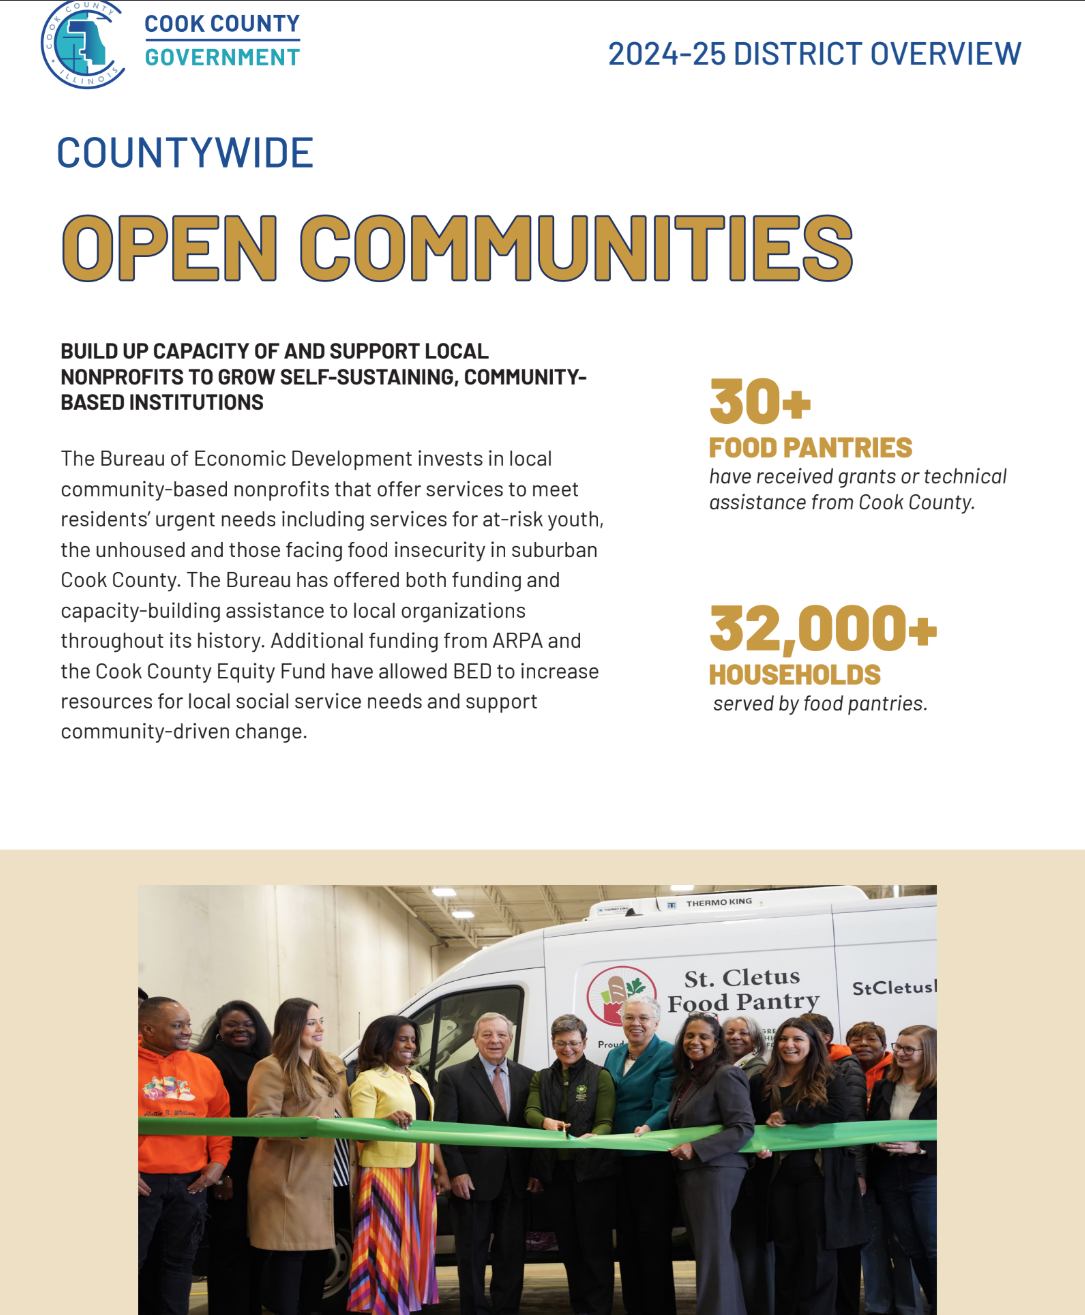
Each district report was structured around Cook County's six strategic Policy Pillars, the framework from the county's official strategic roadmap. Rather than presenting a flat list of metrics, every data point was mapped to a pillar, giving each district report six dedicated pillar pages. A resident could open their district's report, flip to "Healthy Communities," and see exactly what the county was delivering in their area under that priority.
Ensure Cook County provides responsive, transparent services and develops a thriving, professional workforce that reflects the communities served.
Provide innovative infrastructure that will connect people and communities to increase equity, support economic growth and improve residents' quality of life.
Create safe communities and an equitable and fair legal system for all residents.
Pursue inclusive economic and community growth by supporting residents, growing business, attracting investment and nurturing talent.
Support healthy, resilient communities that thrive economically, socially and environmentally.
Improve the physical, mental, and social well-being of Cook County residents and communities.
Report Preview
Click any image to view full size.
Investments summary page
Policy pillar page sample
Metrics page sample
Key Takeaways
Government data is rarely ready to use. Producing accurate district-level metrics required building a custom aggregation methodology from scratch, combining Python, Census API data, and geospatial shapefiles to bridge the gap between ZIP-level reporting and district boundaries.
Stakeholder management is as important as technical execution. Coordinating 20+ department contacts, each with different data systems, timelines, and definitions, required clear communication, structured templates, and persistent follow-up throughout the project lifecycle.
Data documentation matters. Creating a data dictionary and SOPs from the ground up not only ensured consistency across 17 reports but left the office with reusable infrastructure for future reporting cycles.
Building something new means building it to last. As the first report of its kind at this scale out of Cook County, the project required not just execution but institutional design. Creating the training materials, process guides, and documentation needed ensured the work could continue well beyond a one-year fellowship.